 ar
ar bg
bg hr
hr cs
cs da
da nl
nl fi
fi fr
fr de
de el
el hi
hi it
it ko
ko no
no pl
pl pt
pt ro
ro ru
ru es
es sv
sv tl
tl iw
iw id
id lv
lv lt
lt sr
sr sk
sk sl
sl uk
uk vi
vi et
et hu
hu th
th tr
tr fa
fa ms
ms hy
hy ka
ka ur
ur bn
bn mn
mn ta
ta kk
kk uz
uz ku
ku
load cell connection diagram
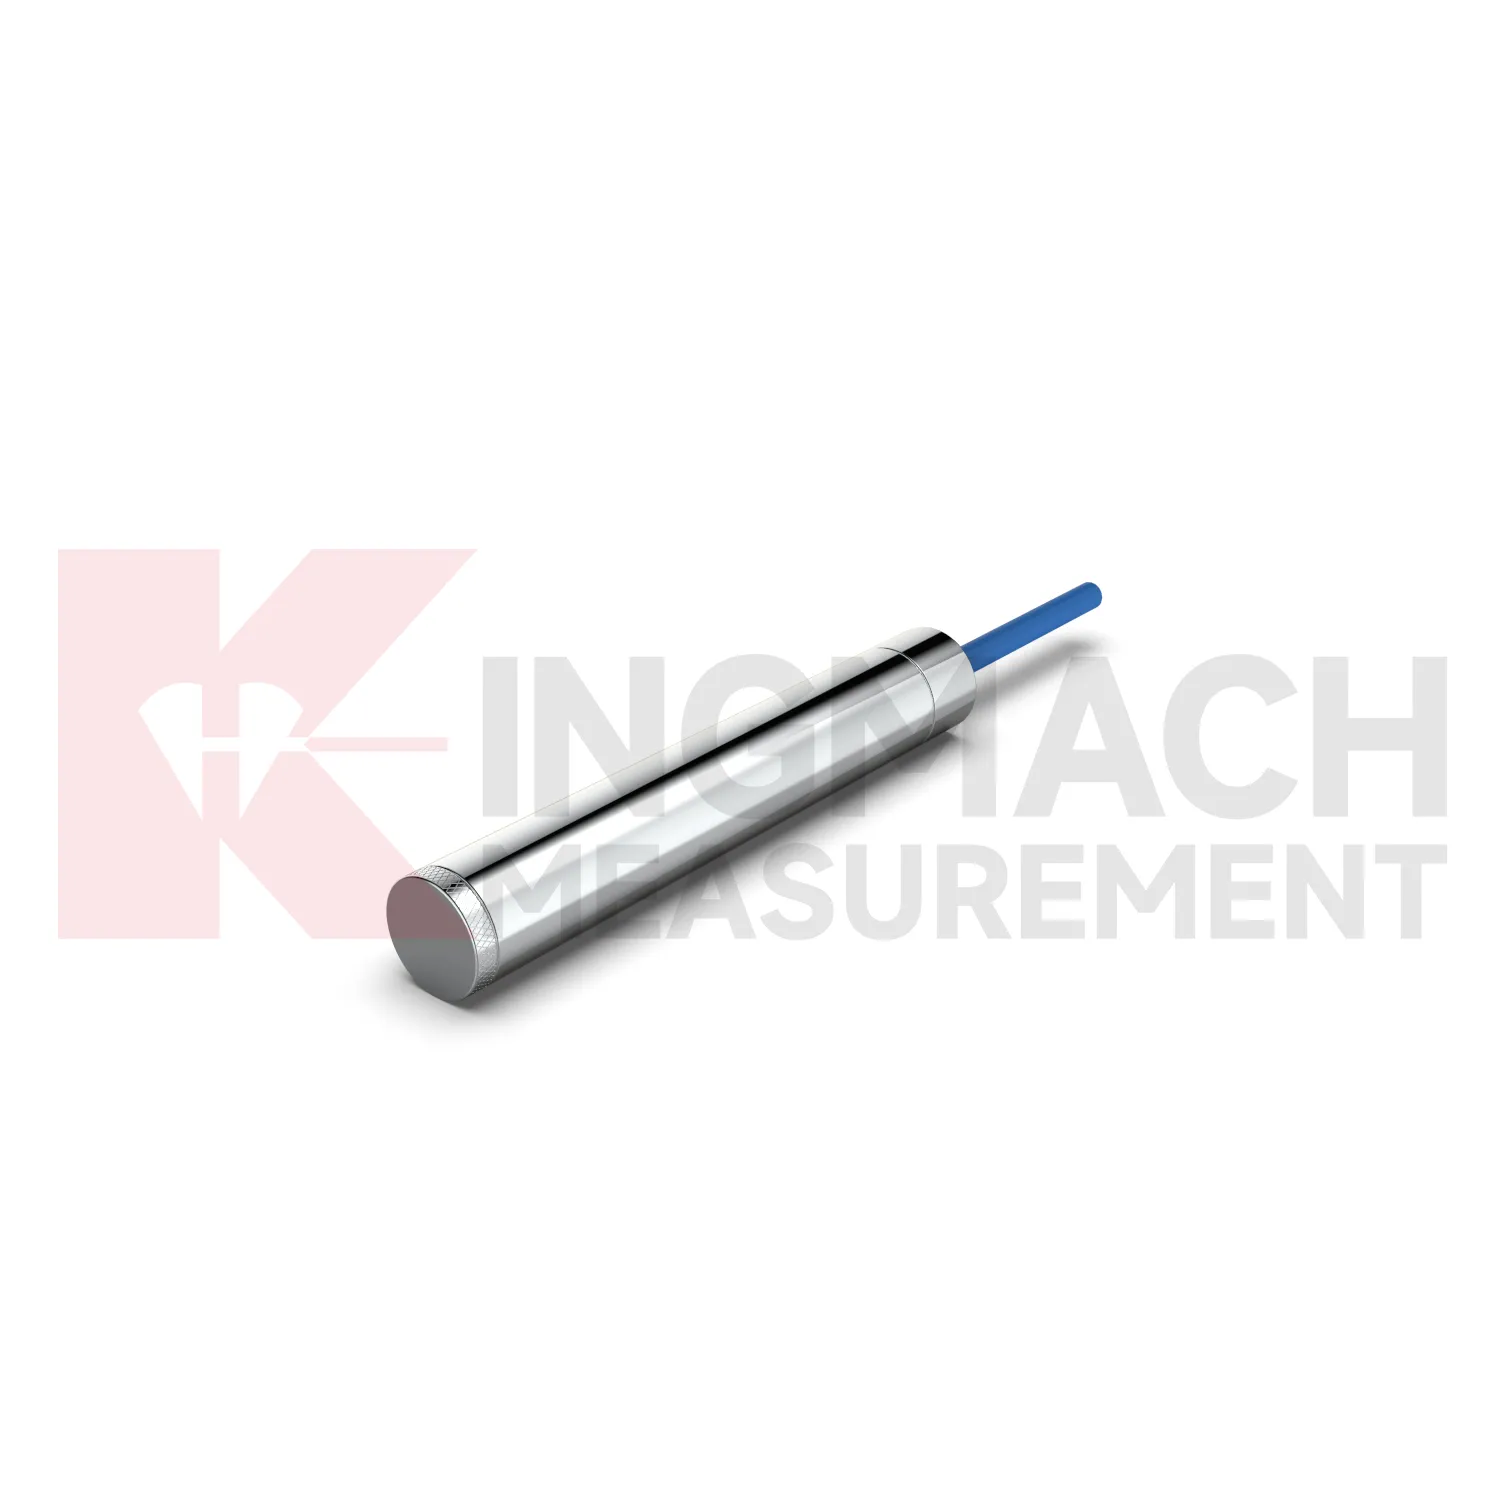
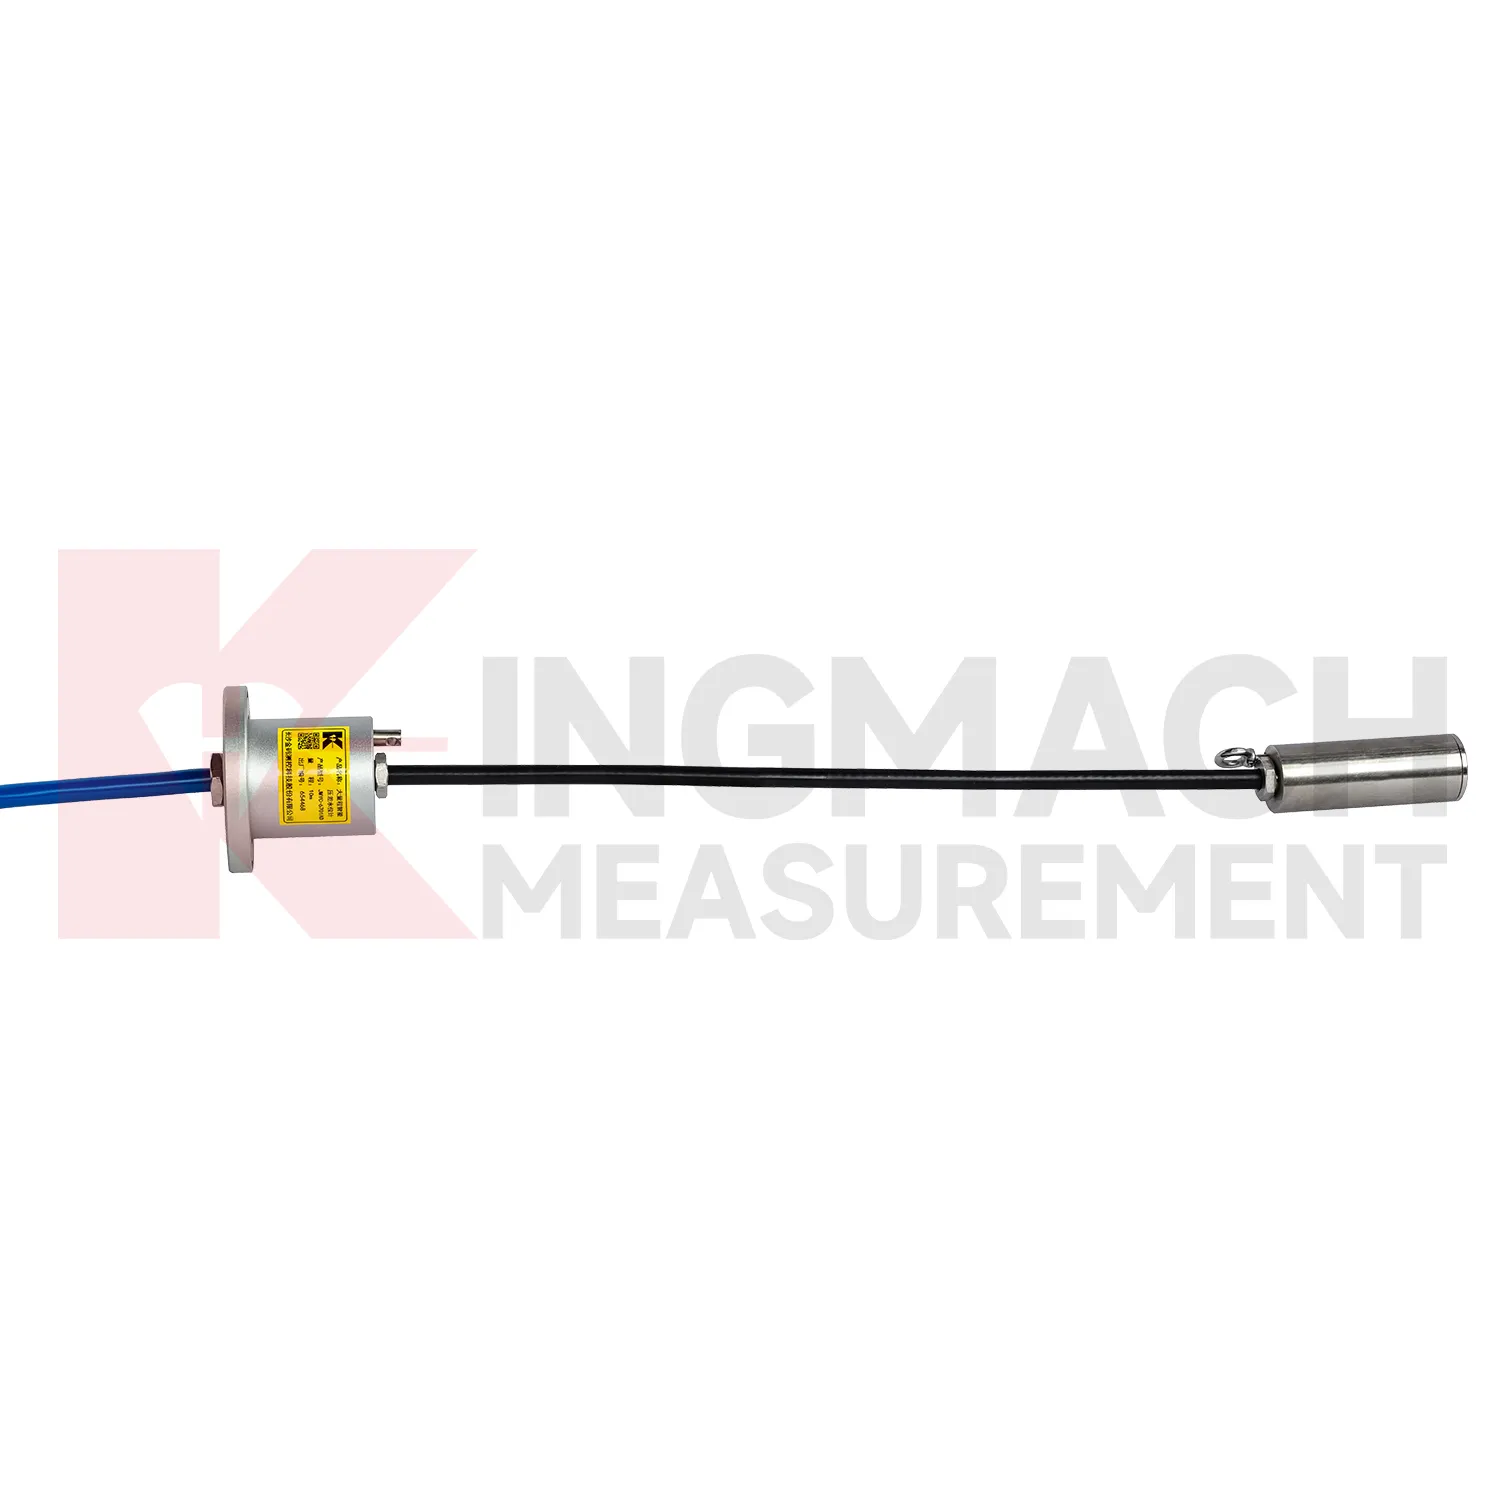
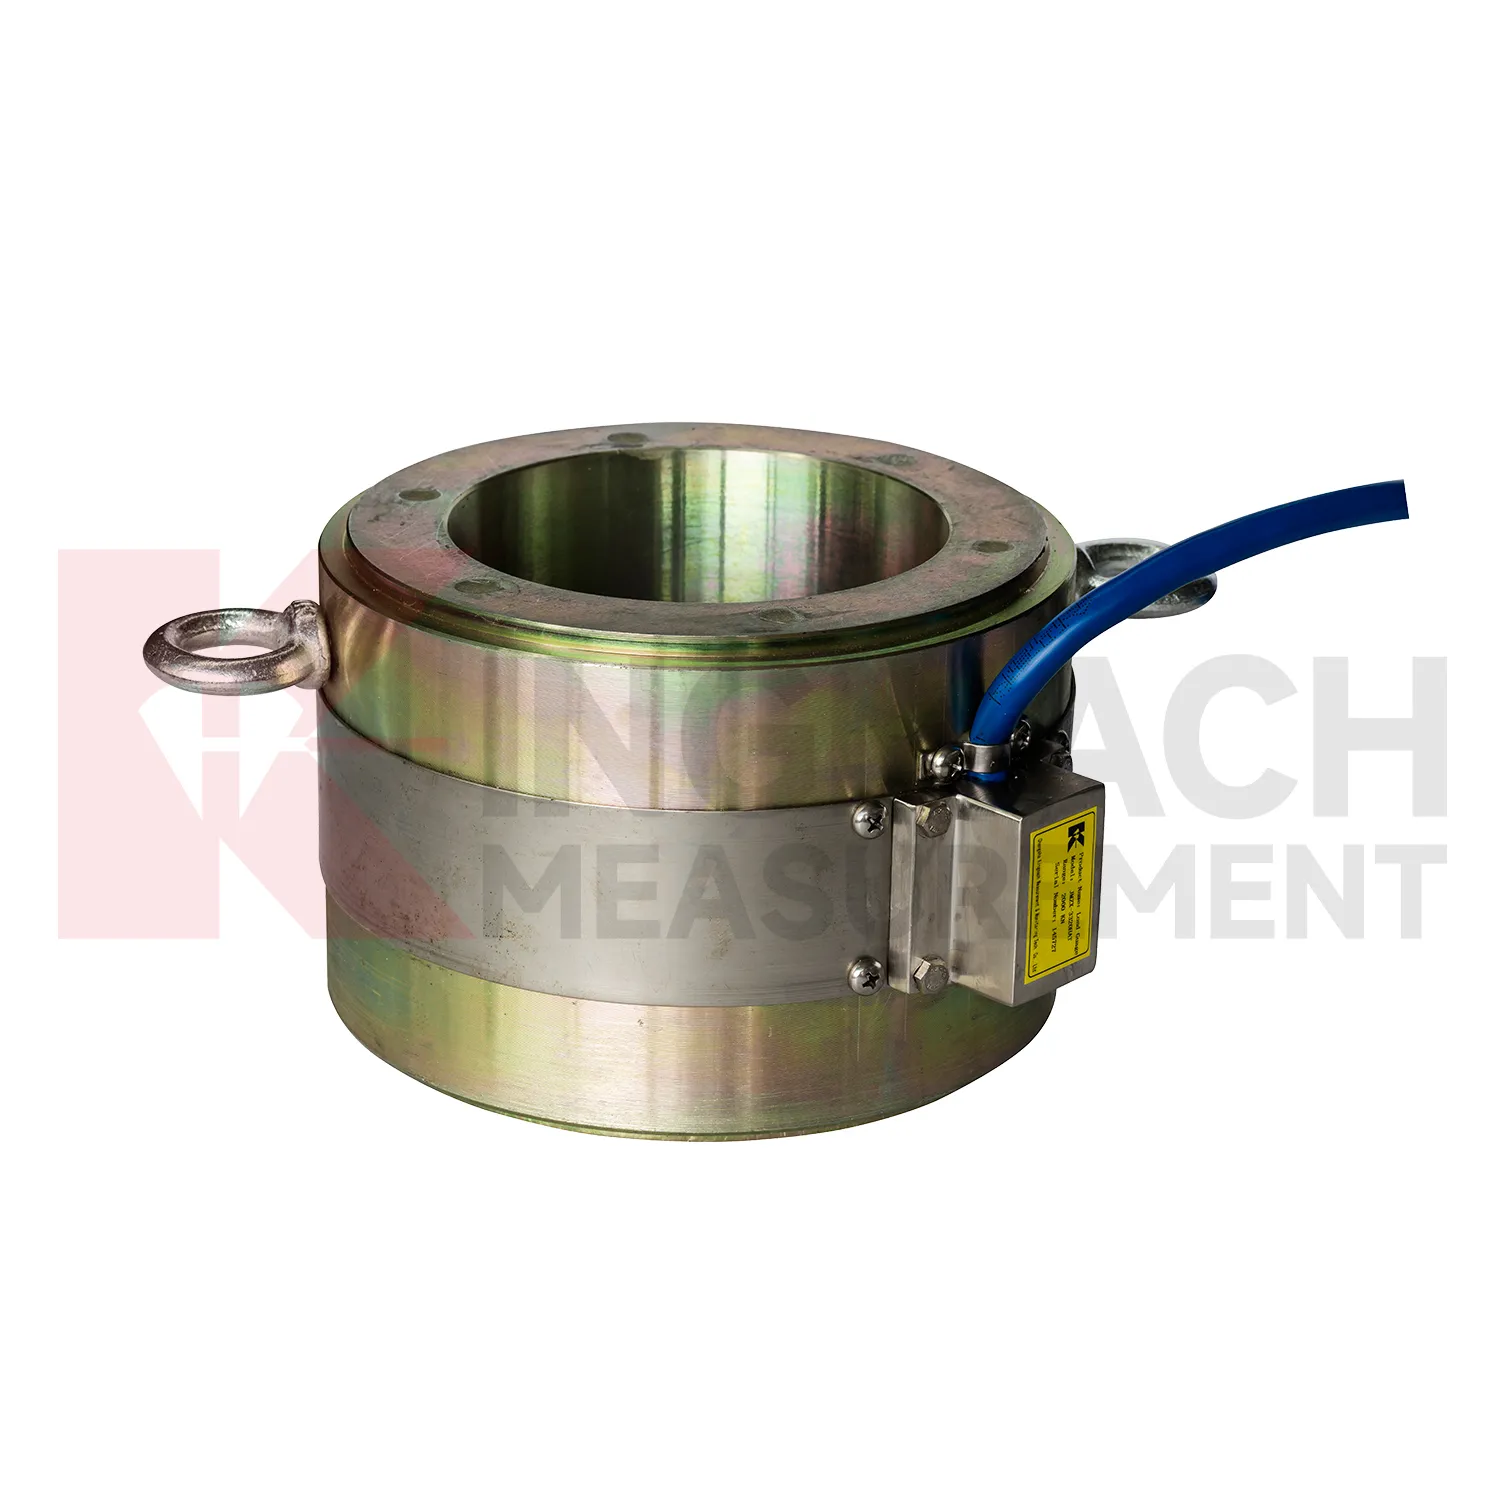
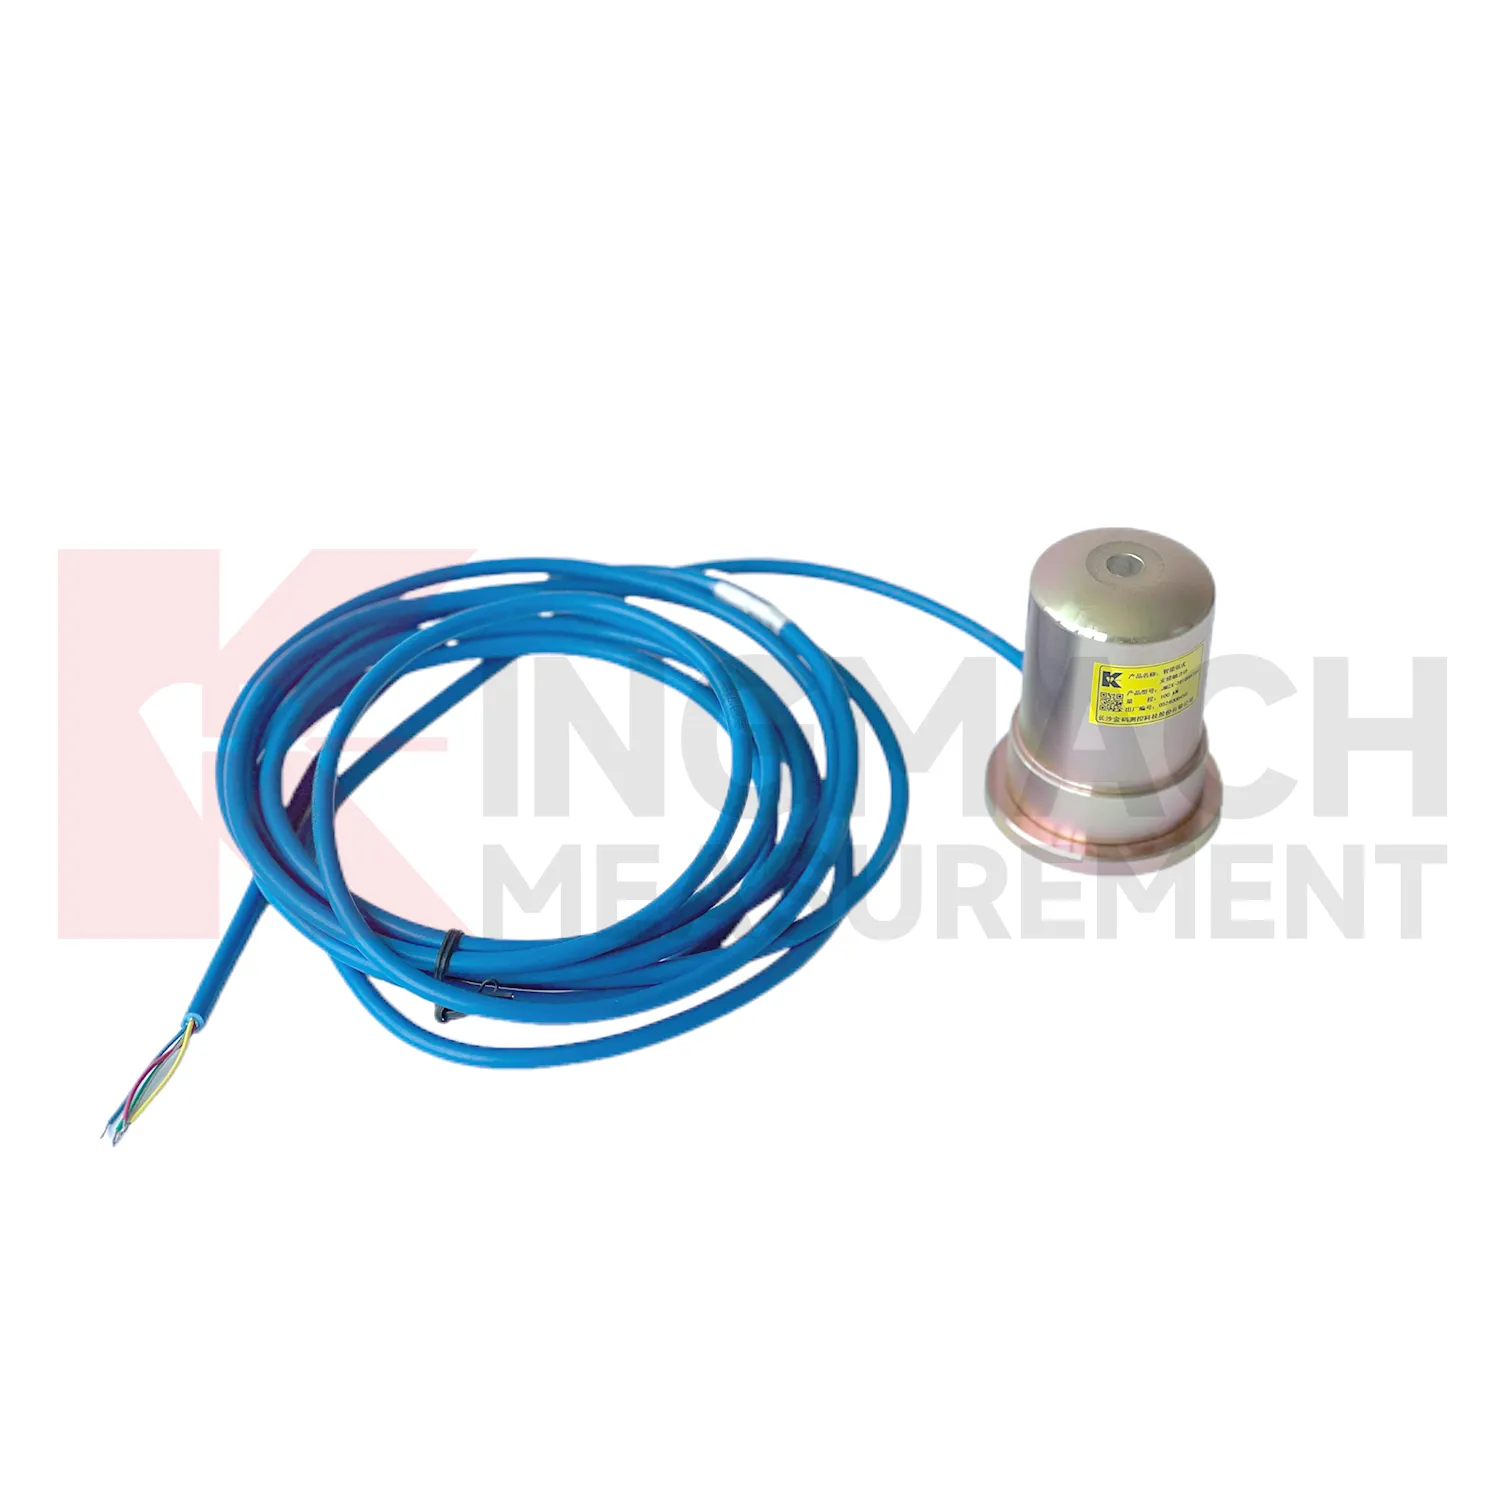
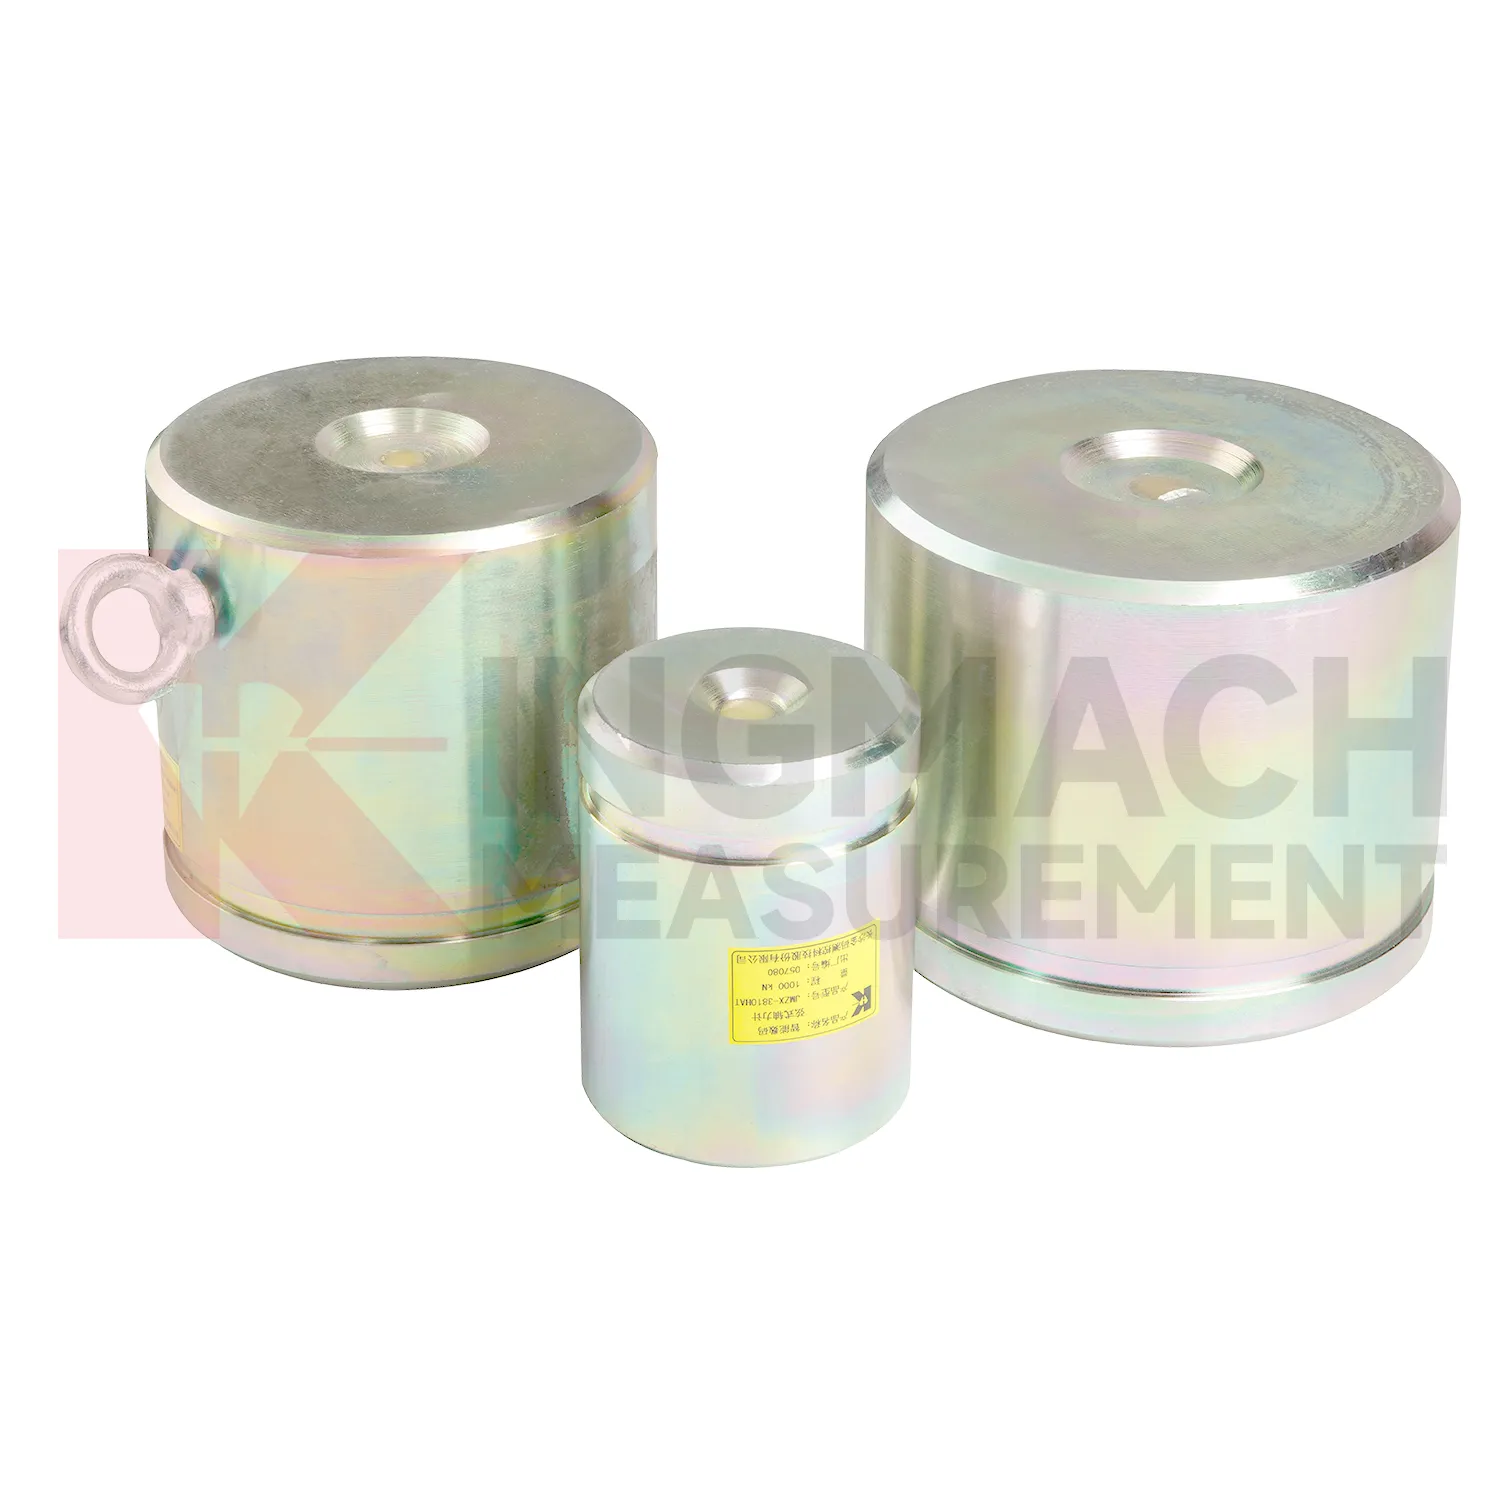
Kingmach load cell connection diagram covers more than one mechanical form, which matters because force does not enter every structure the same way. The solid load cell JMZX-35XXHAT is listed for 1000 kN to 10000 kN with 0.1 kN resolution and 0.5%FS precision. The same product file gives a -30°C to 80°C working temperature range, 20 to 50%F.S. range overload, and 300 to 400%F.S. failure overload. It also stores model, number, calibration coefficient, pressure value, zero parameter, and temperature correction data. These points make it better suited to compression load checks such as pile load testing, bridge pier support measurement, and heavy structural bearing work. The instrument is part of a larger Kingmach monitoring catalog that includes displacement, settlement, tilt, pressure, water level, and acquisition products. For procurement, the practical review should cover capacity margin, bearing surface geometry, calibration documents, expected temperature range, overload exposure, and whether the readings will be taken locally or fed into an automated system. Kingmach also presents the product family alongside project areas such as bridges, dams, tunnels, subways, slopes, buildings, subgrades, wind towers, and foundation pits. That makes the specification less abstract: each model can be matched to a known load path and a known field environment before ordering.
Application of load cell connection diagram
In railways, highways, and transport corridors, load cell connection diagram can monitor bridge support loads, subgrade pressure, retaining structure forces, and temporary works near active traffic. The difficulty is that access windows are short, vibration is frequent, and data gaps can create uncertainty during maintenance review. Kingmach smart load products support digital output, anti-interference transmission, built-in temperature correction, and stored model or calibration information. Solid load cells list 1000 kN to 10000 kN ranges and 0.5%FS precision, while axial force meters cover 200 kN to 3000 kN for support load points. These specifications suit high capacity structural members and staged construction near operating routes. A monitoring plan should record traffic condition, construction activity, temperature, and any maintenance event near the sensor. For owners, the value lies in trend comparison: whether support loads change after traffic opening, whether subgrade pressure rises after heavy rainfall, or whether temporary structures remain within expected force limits before removal. For transport corridors, the inspection schedule should account for possession windows, traffic vibration, and safe access. Remote acquisition may reduce field visits, but periodic visual checks still catch damaged cables, water entry, and loose junction boxes. Access for inspection should also be planned before backfilling, because later hardware checks may be harder than taking the reading itself.
The future of load cell connection diagram
Future load cell connection diagram maintenance will be shaped by long life assets such as dams, bridges, slopes, and transport corridors. Kingmach products that list 50 year design life, waterproof durability, temperature correction, and stored records are already moving in that direction. The next improvement is not just longer service life, but easier proof that the reading remains valid. Owners may require digital calibration files, sensor identity chips, maintenance timestamps, and platform records that survive system upgrades. MEMS sensors, vibrating wire sensors, and smart acquisition units may be used together, with each type assigned to the job it handles best. AI warning models can compare slow force drift with water level, temperature, rainfall, and movement data, but field checks will still matter. A low maintenance design should therefore include sealed connectors, stable cables, lightning protection planning, and clear calibration intervals. Future systems will be judged by how little uncertainty they leave during inspection.
Care & Maintenance of load cell connection diagram
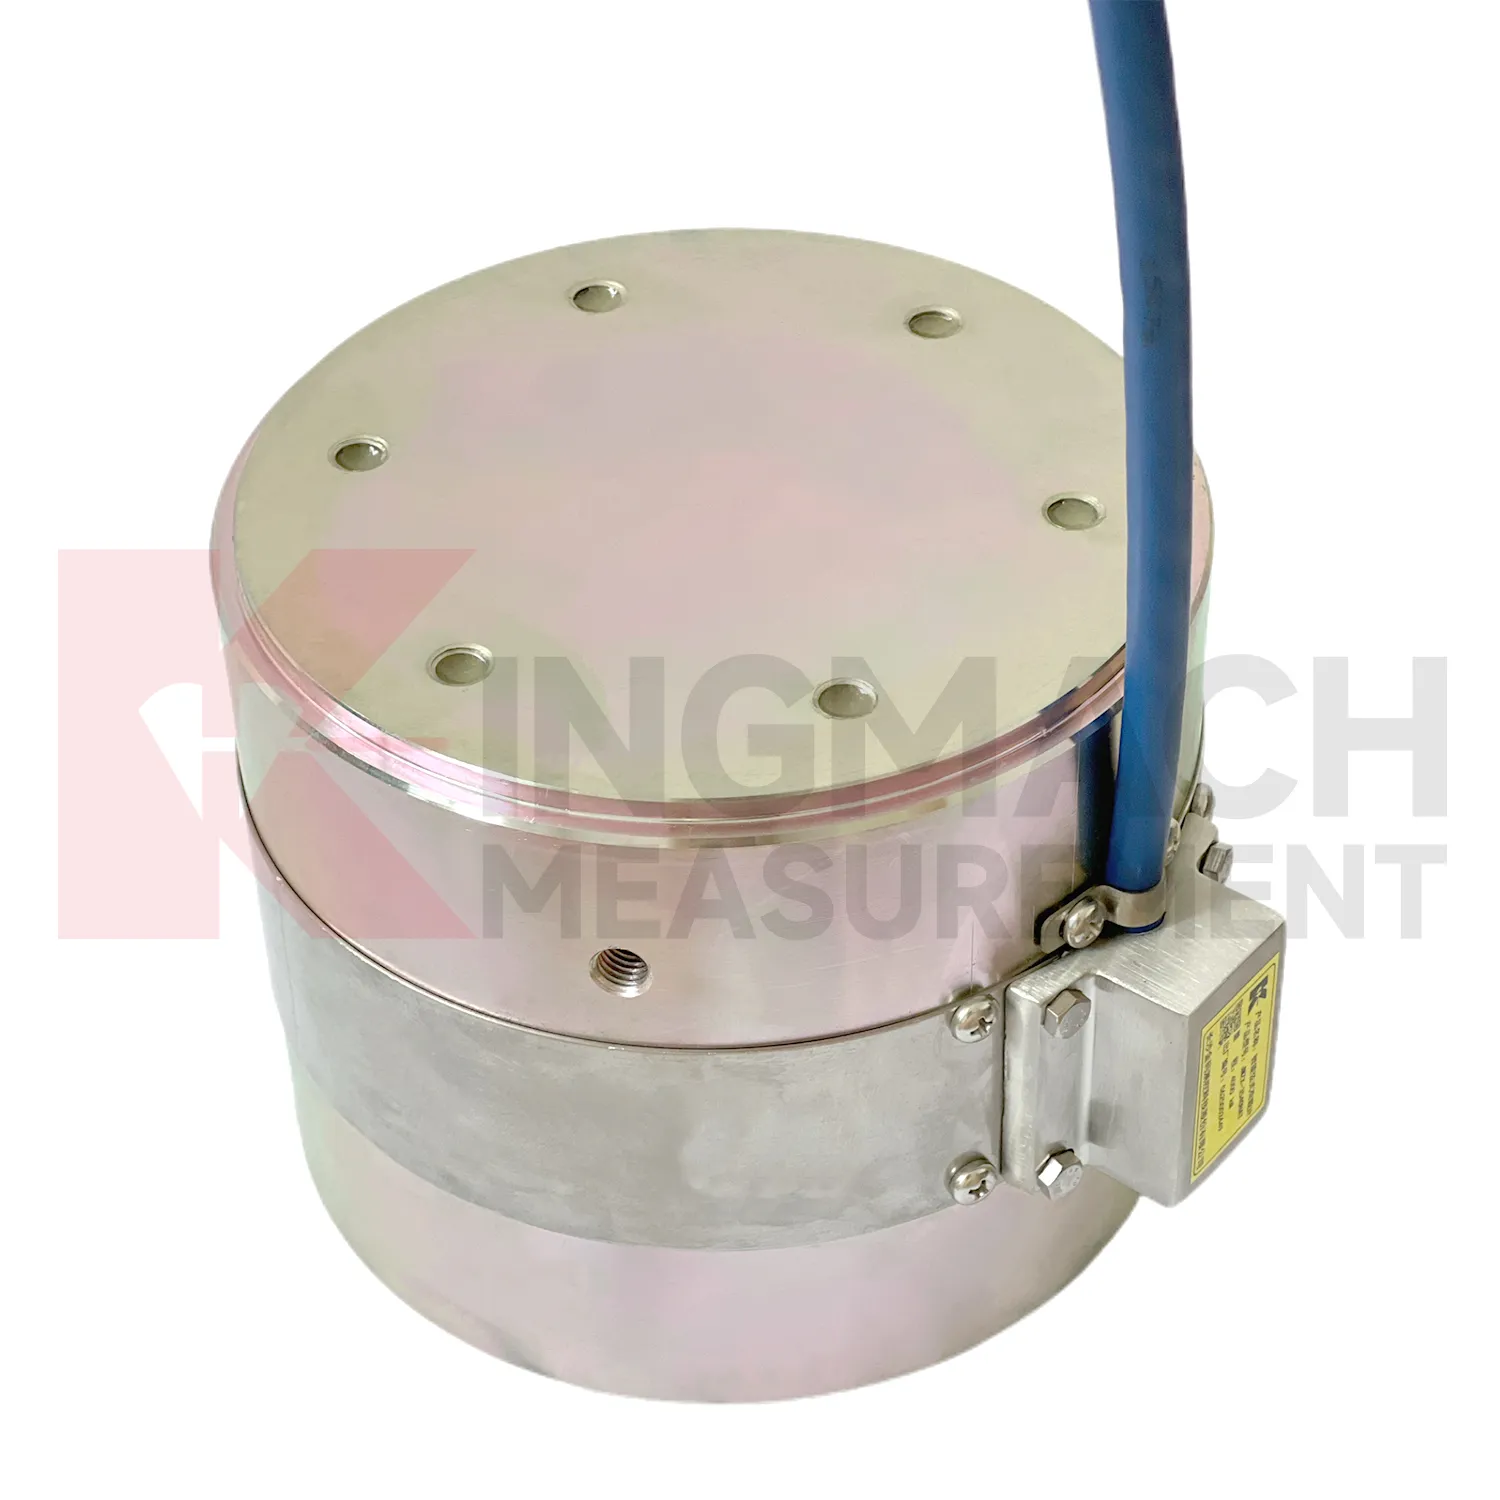
For load cell connection diagram, procurement and maintenance teams should agree on records before the product reaches the site. The box should not arrive as an anonymous device. The file should contain model, range, dimensions, calibration coefficient, certificate requirements, cable length, readout method, and any custom order notes. Axial force meters are often customized, with model, range, and dimension confirmed at order and lead time often planned around 20 to 30 days. During installation, check that the delivered item matches the support diameter, bearing plate layout, and data acquisition plan. During use, keep warranty, calibration, inspection, and repair notes together with the monitoring record. Protect the sensor from overload, impact, water entry, and unauthorized rewiring. If the project changes from manual reading to automated collection, verify scaling and units before comparing new data with older values. Maintenance is easier when the administrative record is as tidy as the hardware installation. Confirm changes before handover.
Kingmach load cell connection diagram
load cell connection diagram belongs at the point where a drawing stops being a guess and the structure begins to report what is really happening. In Kingmach engineering monitoring, force data is used around bridge cables, anchor heads, pier bearings, pile tests, retaining systems, and temporary steel supports. The reading is not only a number in kN. It is a record of where the force sits, when it changed, and which construction or service condition caused that change. A practical monitoring plan often pairs force with displacement, settlement, tilt, temperature, water pressure, or rainfall, because load rarely moves alone. For procurement teams, the useful questions are direct: capacity range, accuracy, installation space, cable route, waterproofing, calibration record, and data acquisition method. When these items are settled before site work starts, the same instrument can support acceptance checks, construction control, and later maintenance decisions without forcing engineers to rebuild the data story. That early planning also keeps later reports from mixing force trends with installation doubts.
FAQ
Q: When is a solid load cell connection diagram more suitable than a hollow type? A: Solid models are commonly used for compression load, pile load testing, bridge pier support checks, and heavy bearing capacity measurement. Q: What specifications does the Kingmach solid load cell list? A: The JMZX-35XXHAT line lists 1000 kN to 10000 kN ranges, 0.1 kN resolution, 0.5%FS precision, and -30°C to 80°C working temperature. Q: How much overload margin is listed? A: Product information lists 20 to 50%F.S. range overload and 300 to 400%F.S. failure overload. Q: What installation errors affect accuracy? A: Eccentric loading, uneven bearing plates, side load, cable pulling, and missing zero records can all distort results. Q: What records should be kept for acceptance? A: Keep calibration coefficient, model, serial identity, load stages, temperature, zero value, and readout setting.
Reviews
Robert Taylor
The weir flow meter is well-built and delivers accurate measurements. Great value for water management applications.
Matthew Garcia
Instrumentation cables are durable and perform well even in harsh environments. Will definitely order again.
Latest Inquiries
To protect the privacy of our buyers, only public service email domains like Gmail, Yahoo, and MSN will be displayed. Additionally, only a limited portion of the inquiry content will be shown.
Evelyn***@gmail.comSouth Africa
Hi, we are a contractor working on tunnel construction and need settlement sensors and displacement ...
Isabella***@gmail.comGermany
Hello, we are evaluating weir flow meters for a water management project. Please share accuracy deta...