 ar
ar bg
bg hr
hr cs
cs da
da nl
nl fi
fi fr
fr de
de el
el hi
hi it
it ko
ko no
no pl
pl pt
pt ro
ro ru
ru es
es sv
sv tl
tl iw
iw id
id lv
lv lt
lt sr
sr sk
sk sl
sl uk
uk vi
vi et
et hu
hu th
th tr
tr fa
fa ms
ms hy
hy ka
ka ur
ur bn
bn mn
mn ta
ta kk
kk uz
uz ku
ku
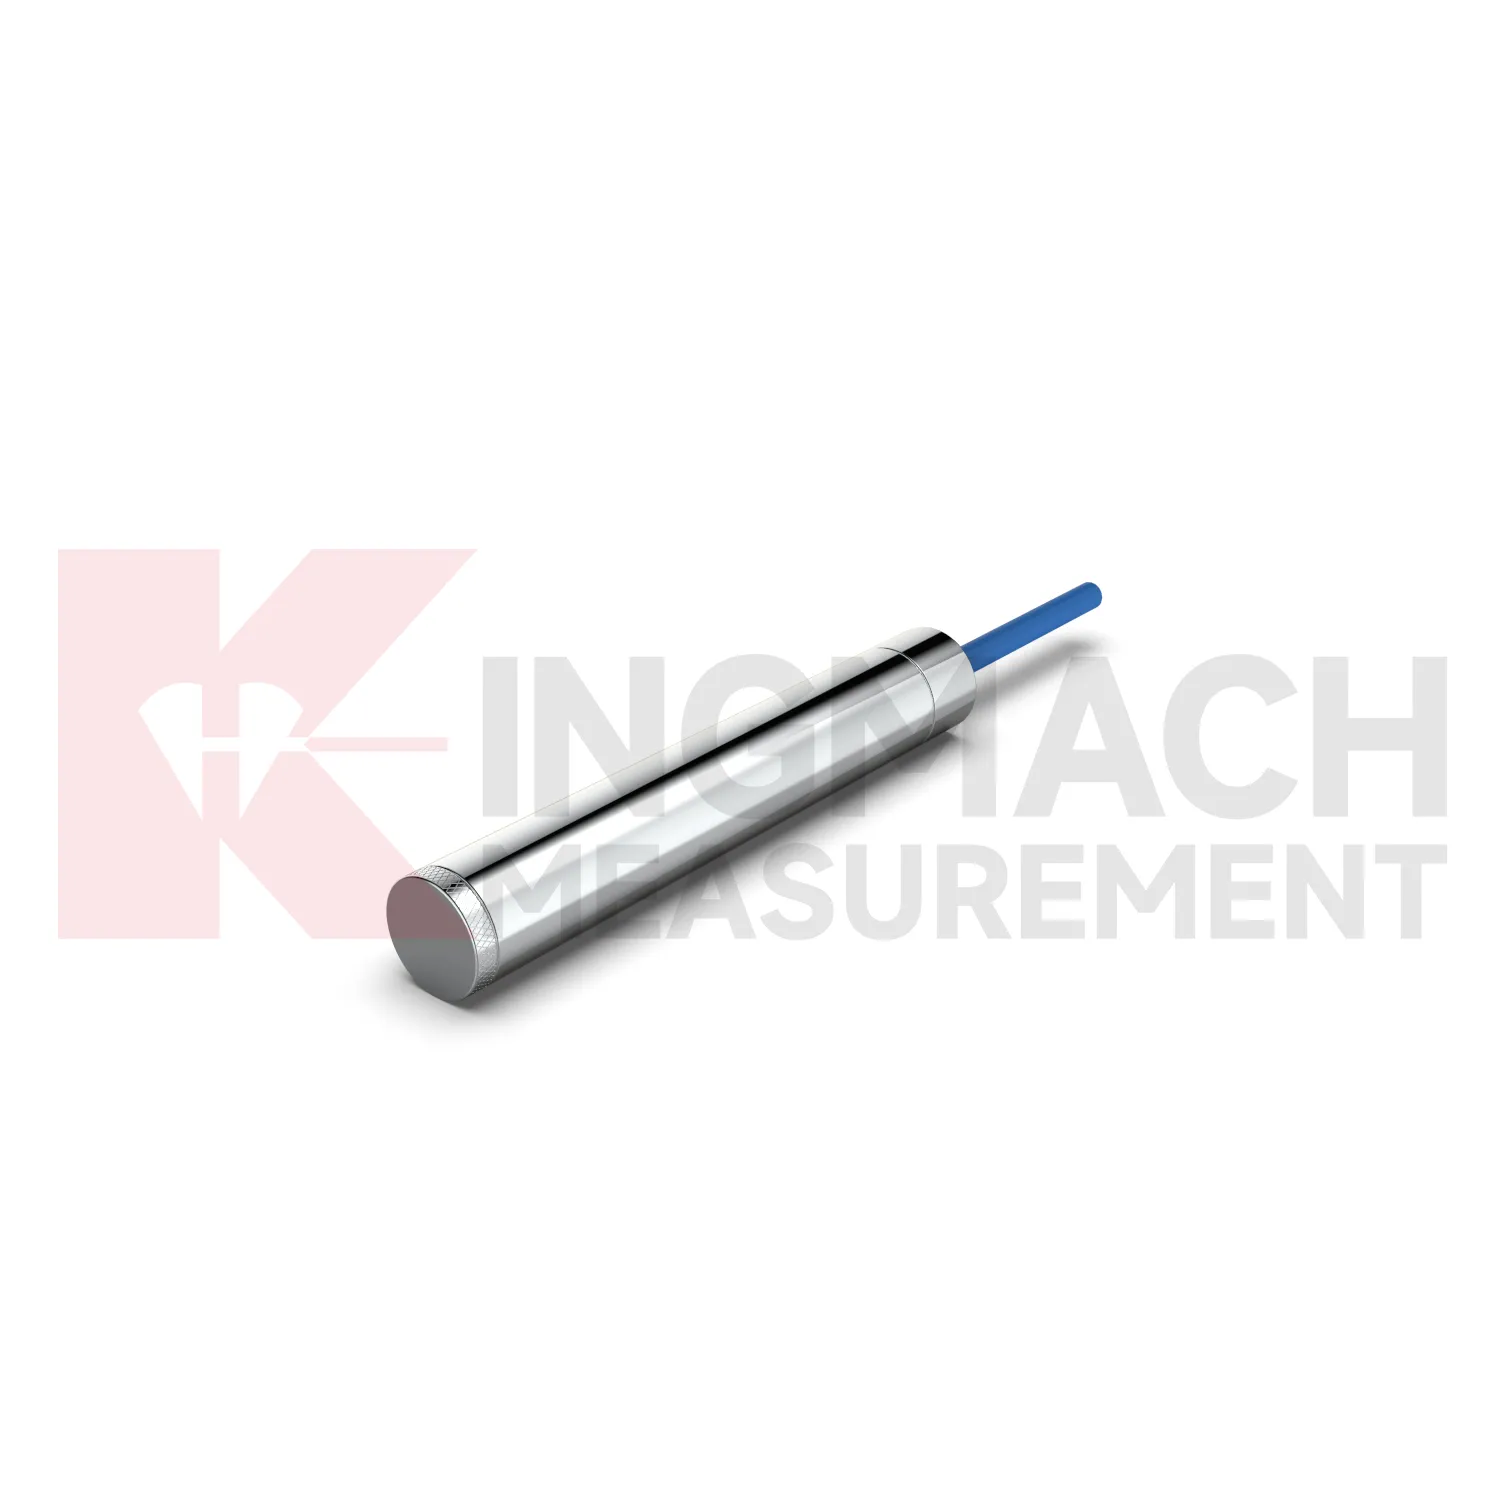
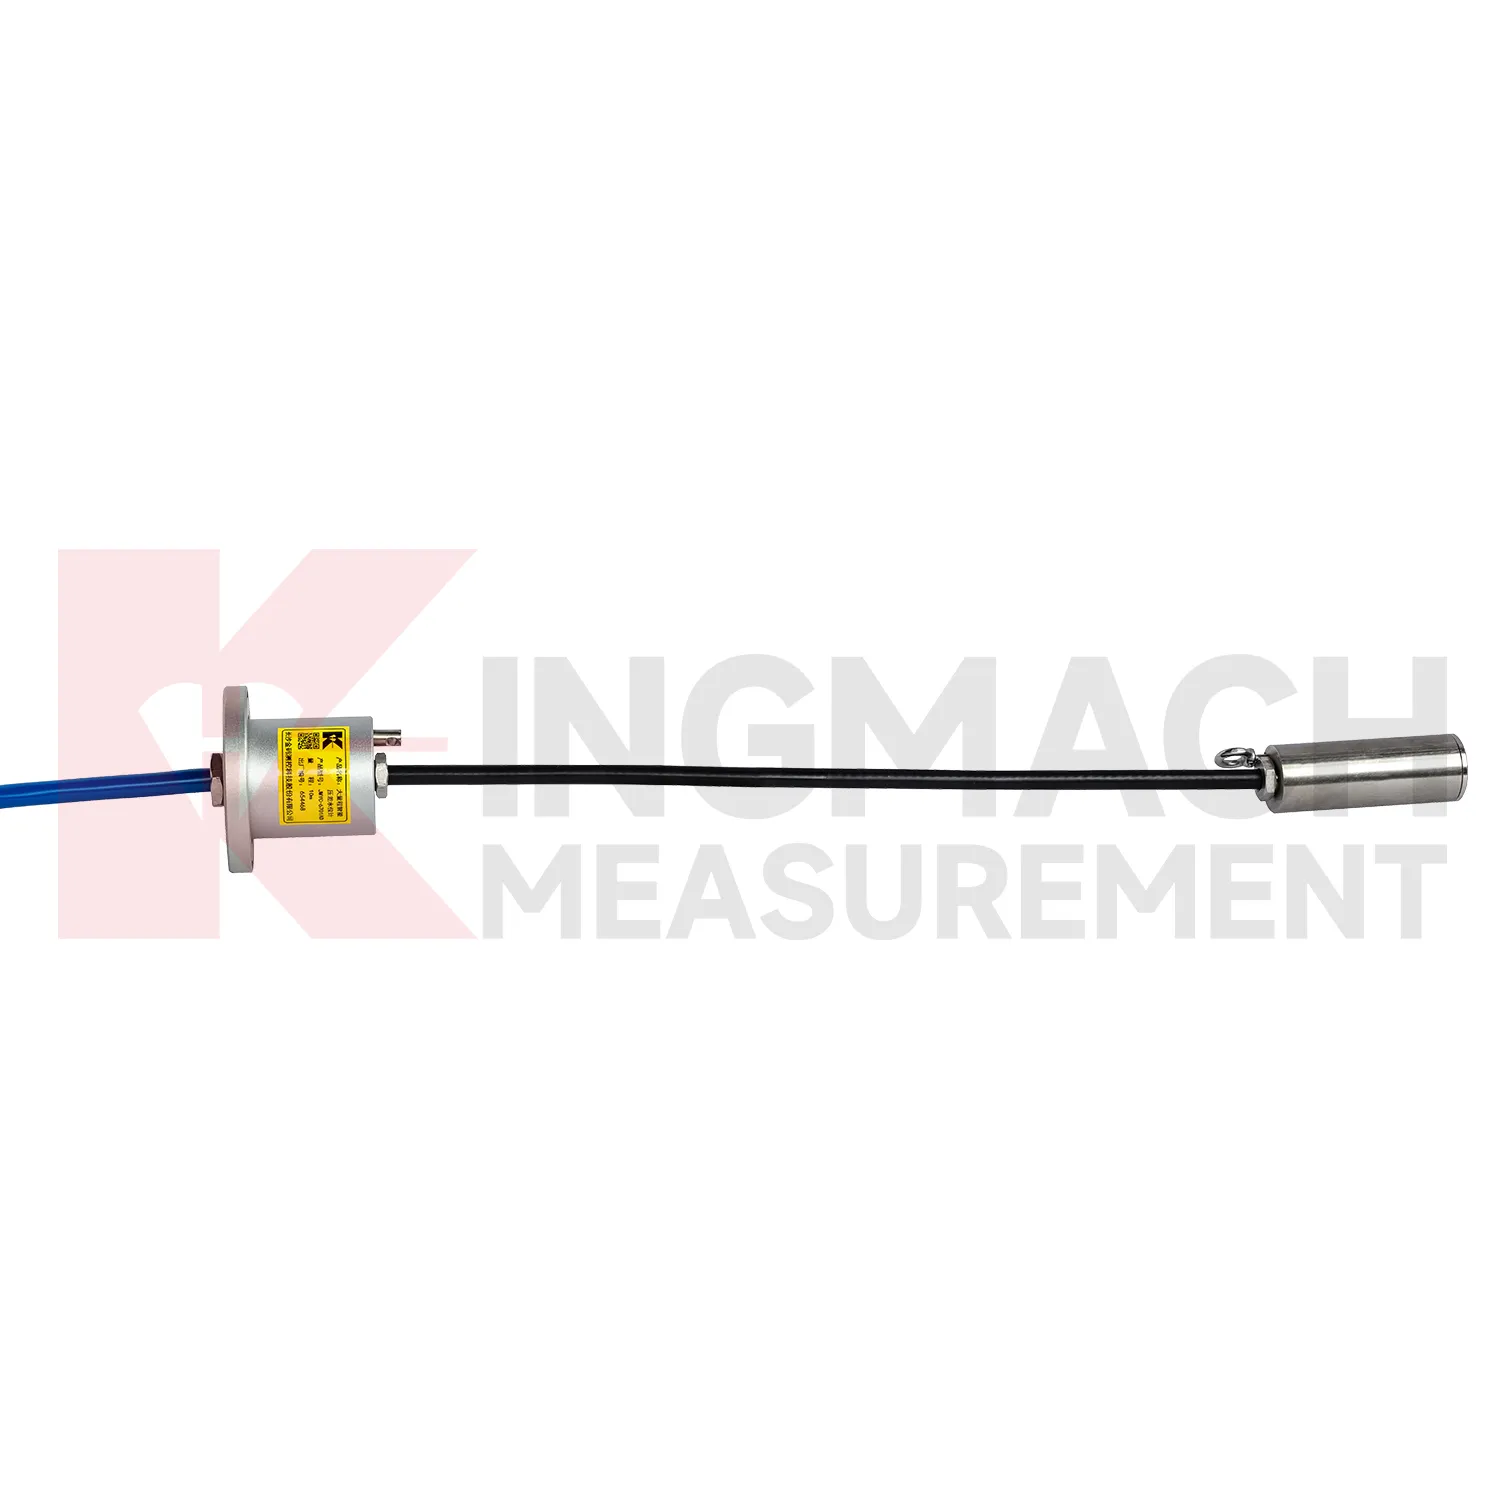
load cell wiring diagram
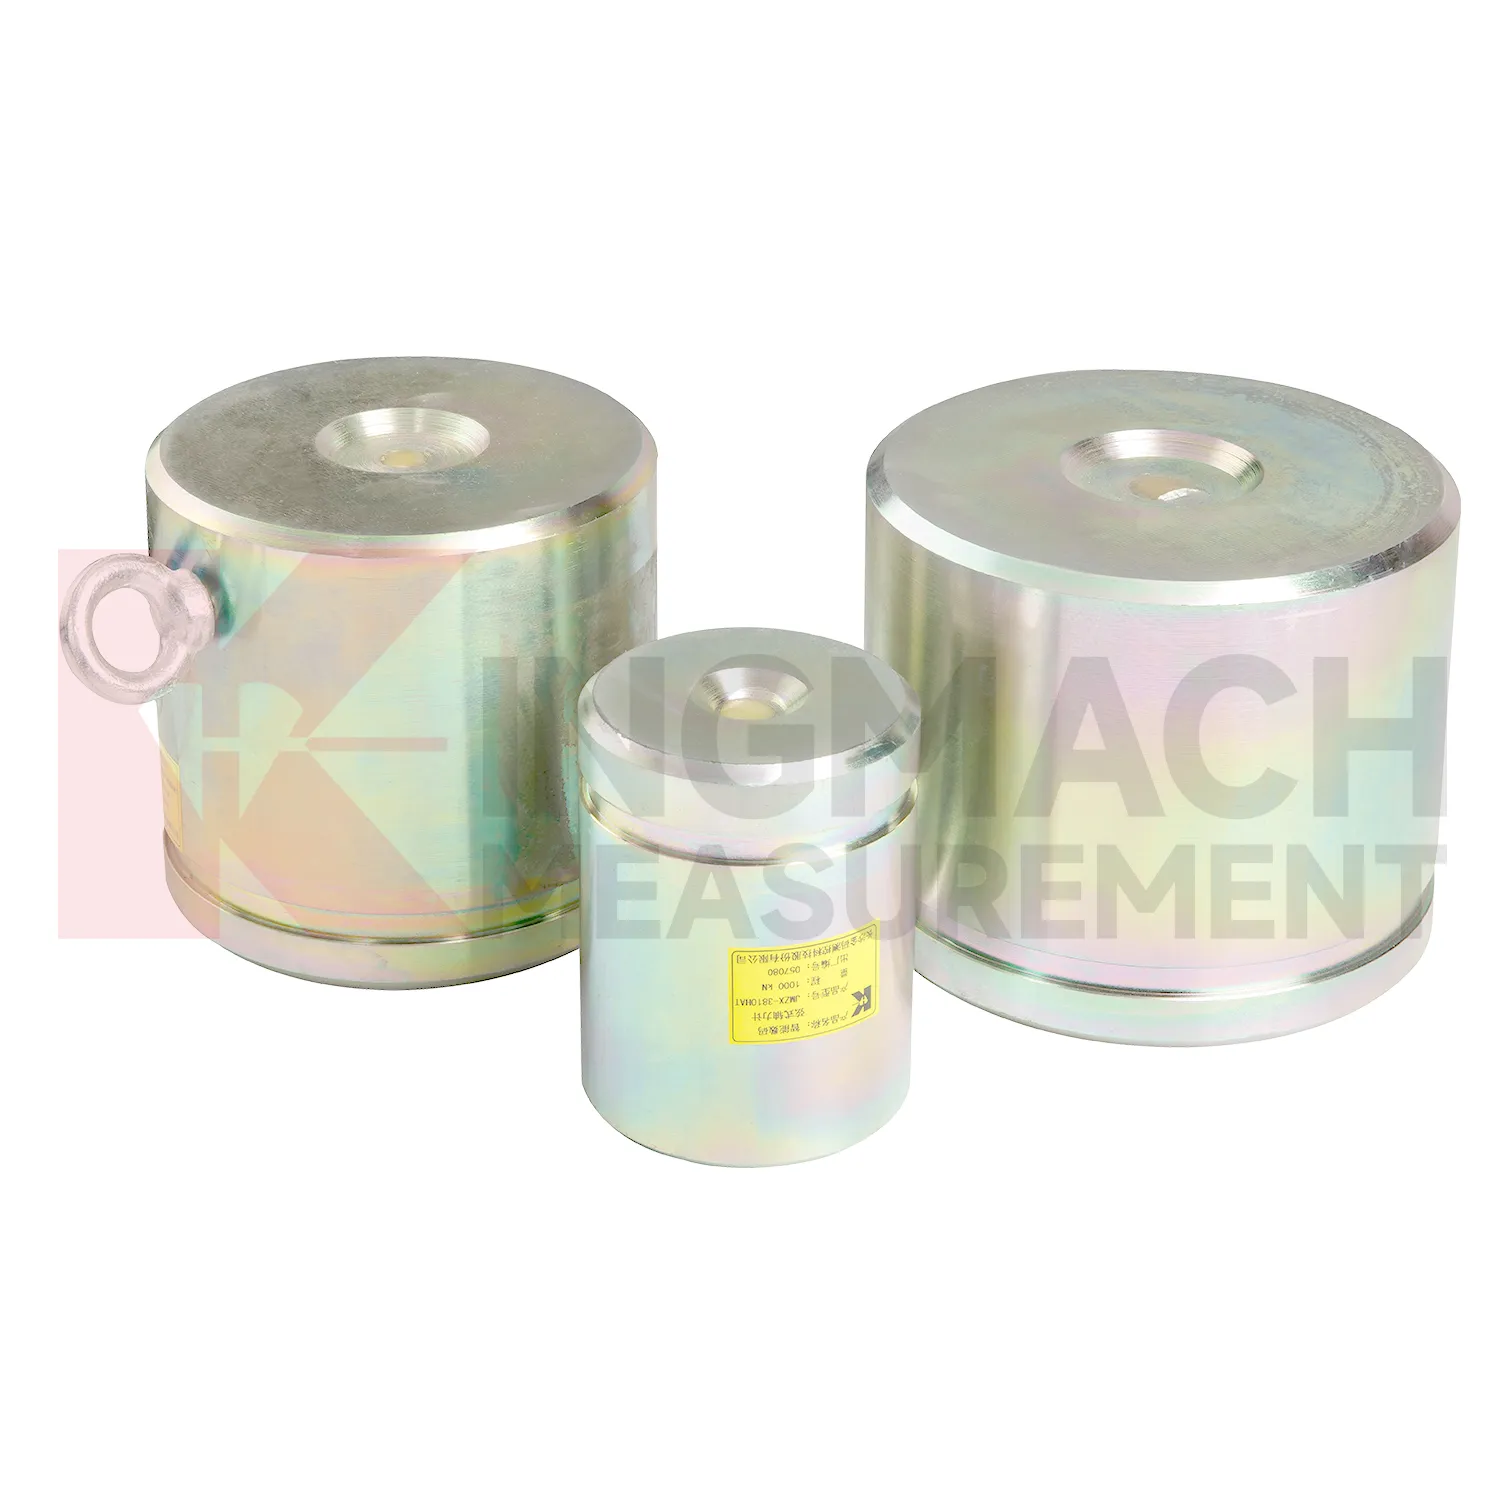
Kingmach load cell wiring diagram for axial force monitoring addresses a common site problem: steel supports in deep foundation pits and tunnels can gain load quickly as excavation progresses. The JMZX-38XXHAT axial force load meter is listed in 200 kN, 500 kN, 1000 kN, 2000 kN, and 3000 kN ranges, with 0.1 kN or 1 kN sensitivity and 0.5%FS accuracy. Its product page lists a 1 MPa waterproof rating, automatic temperature correction, imported high strength steel wires, and direct axial force display in kN rather than only vibrating wire frequency. Claw type installation accessories are provided to help field placement. These features make the product relevant for temporary support monitoring, tunnels, tailings ponds, bridges, buildings, railways, transport, hydropower, and dams. Kingmach also notes that many axial force meters are customized, with model, range, and dimension confirmed at order. That matters when the support diameter, bearing plate thickness, and available clearance are already fixed by the construction design. The brand information also points to practical supply details, including Changsha origin, project use across transport and hydropower works, readout compatibility, and packaging for precision sensors. For engineering buyers, these details help connect catalog parameters with delivery, calibration, installation, and later service expectations.
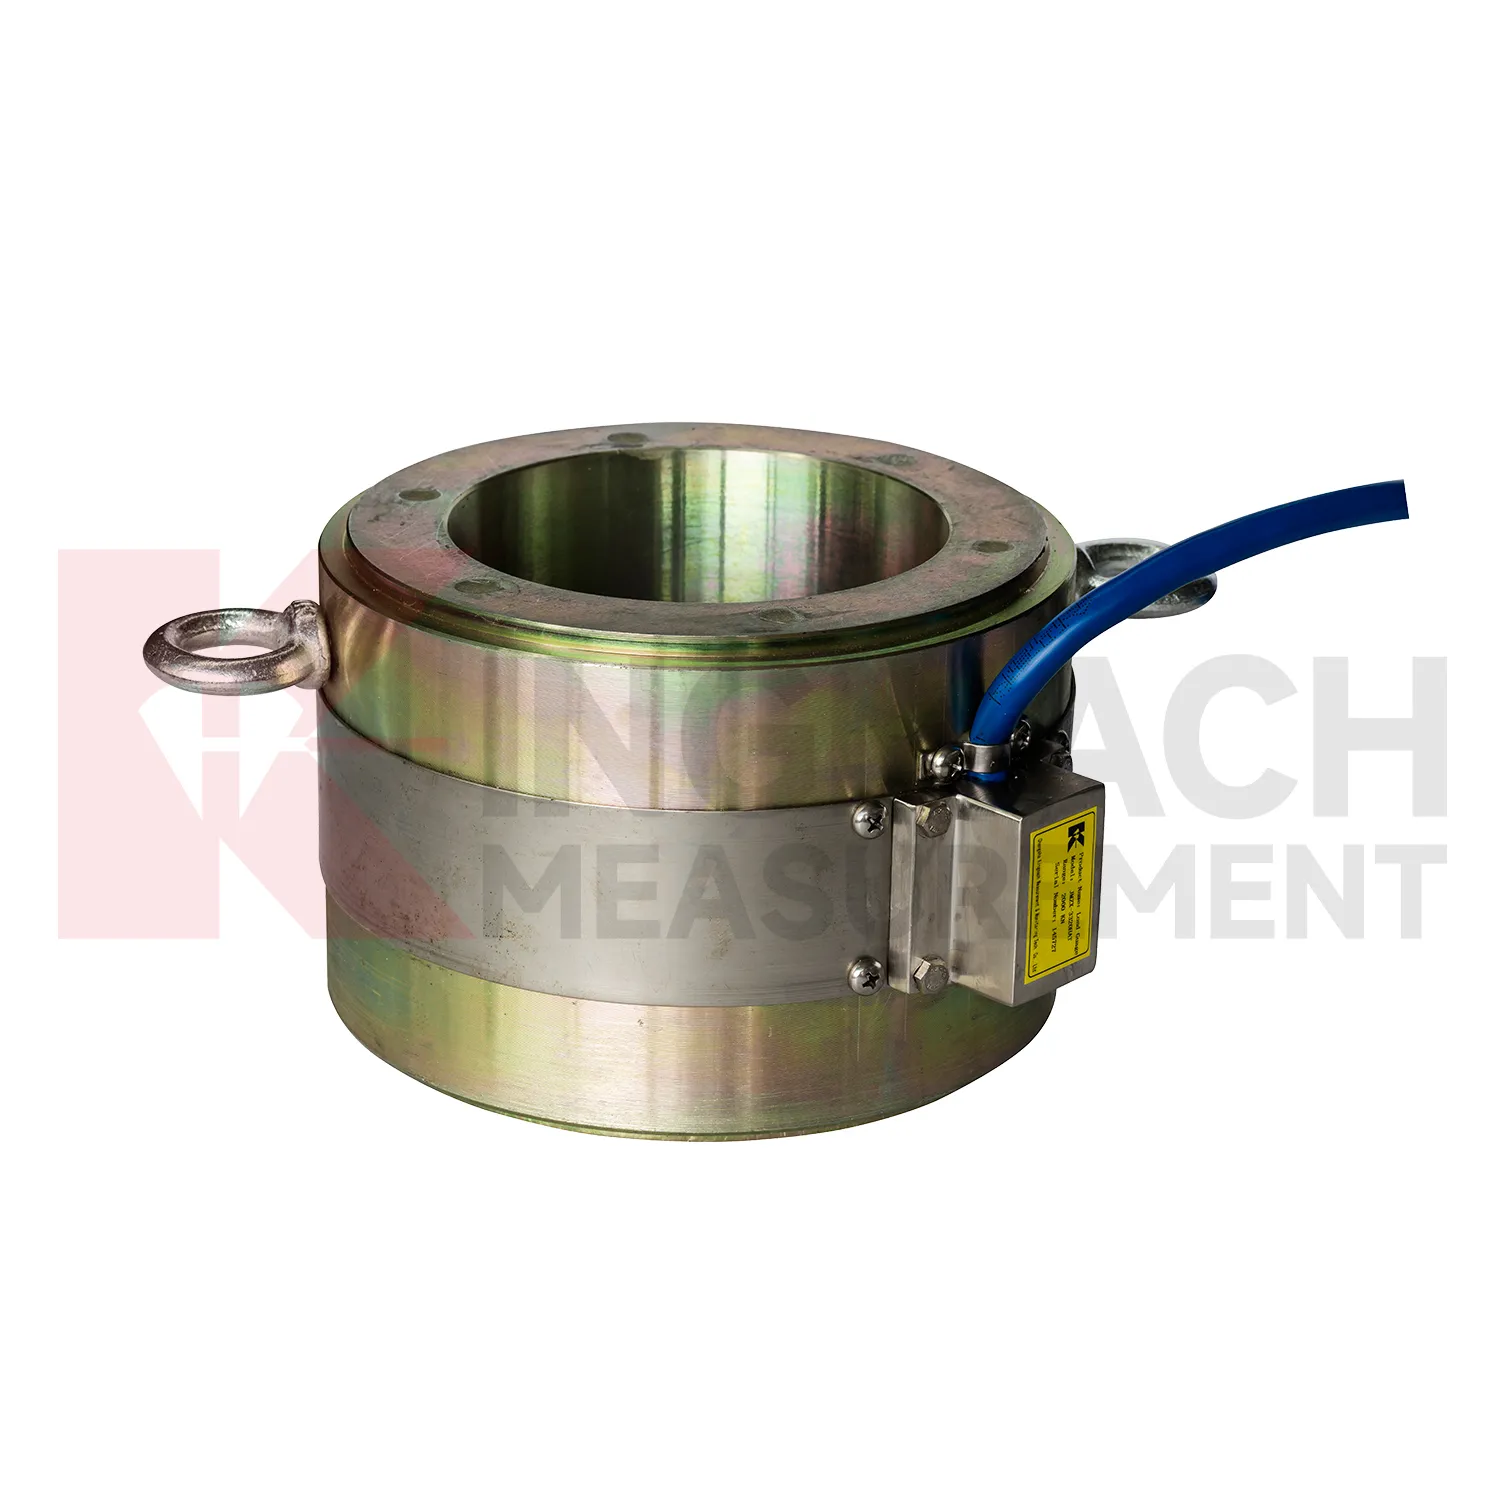
Application of load cell wiring diagram
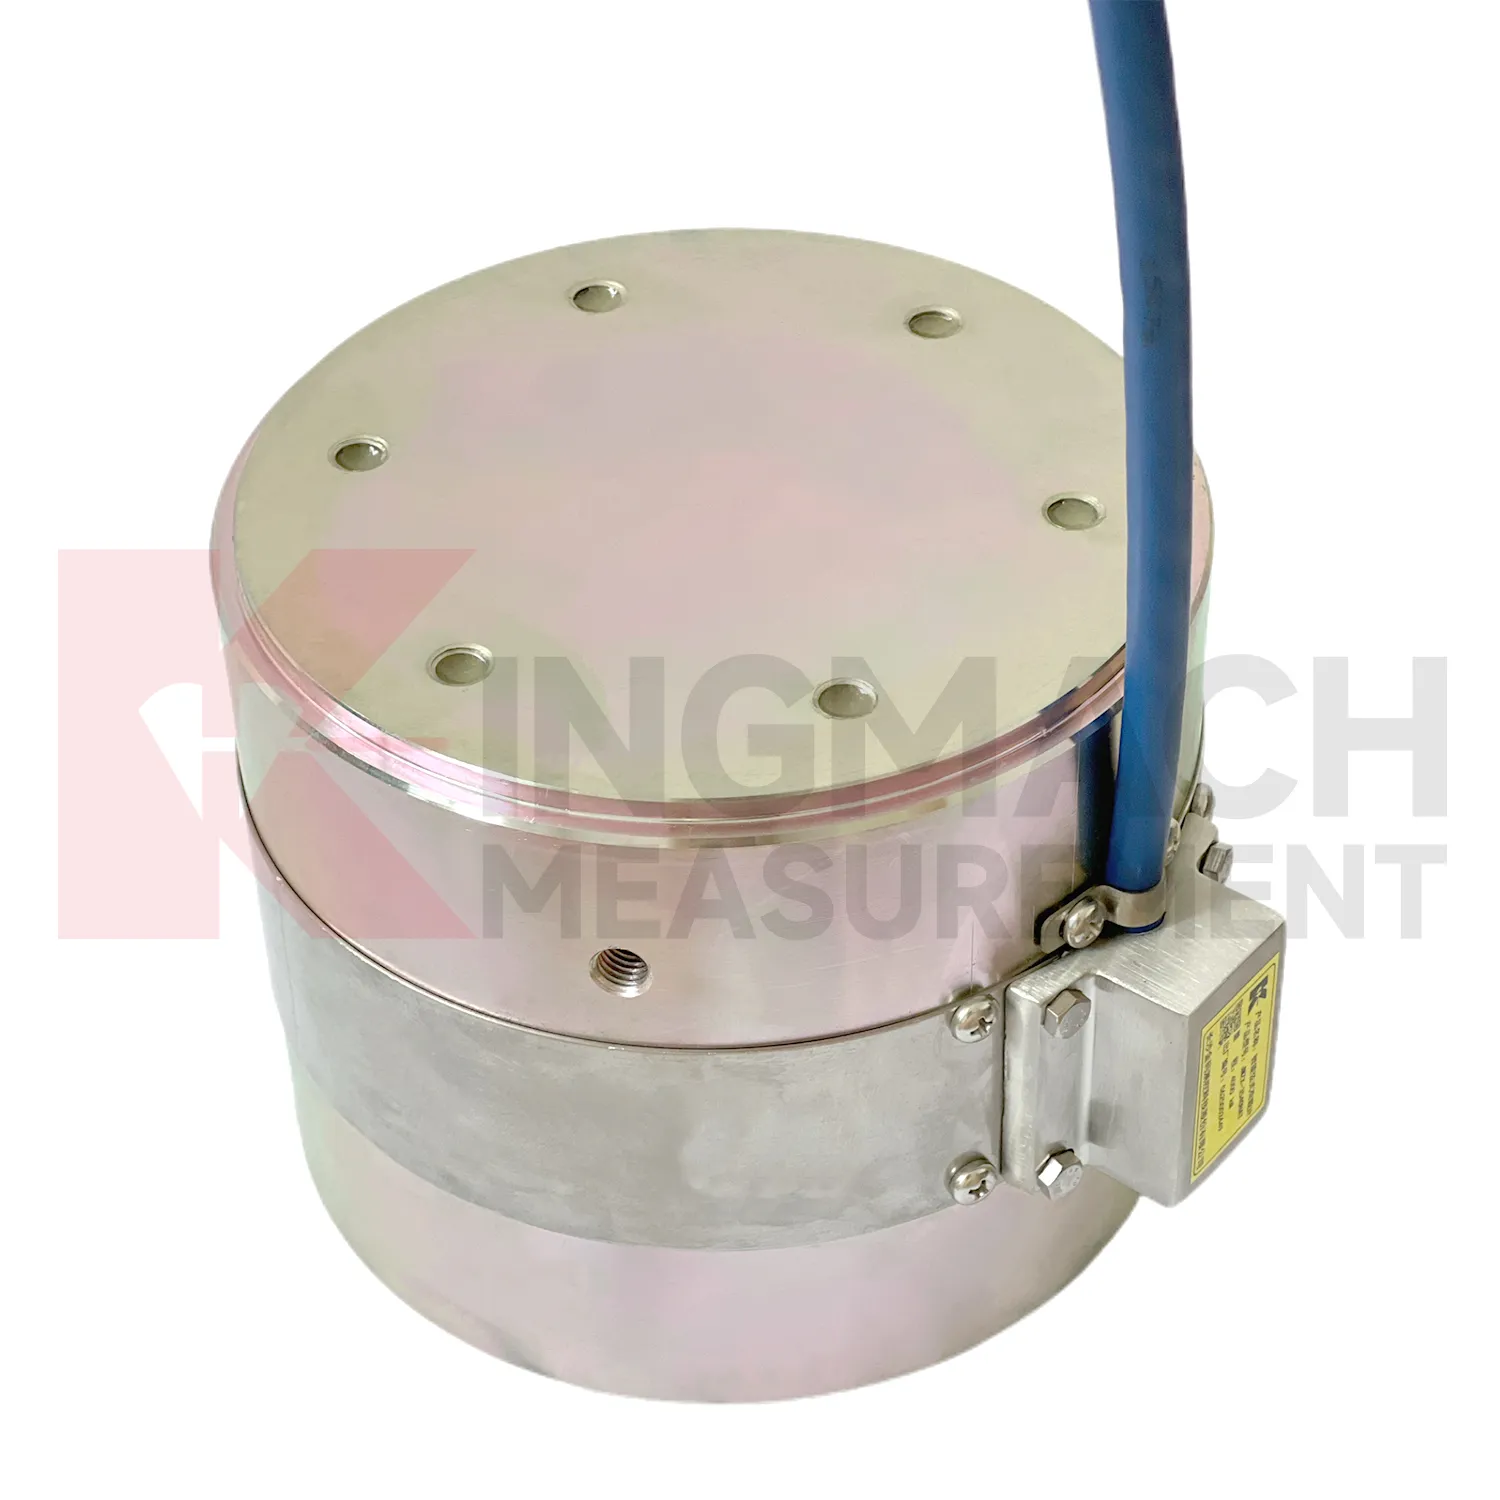
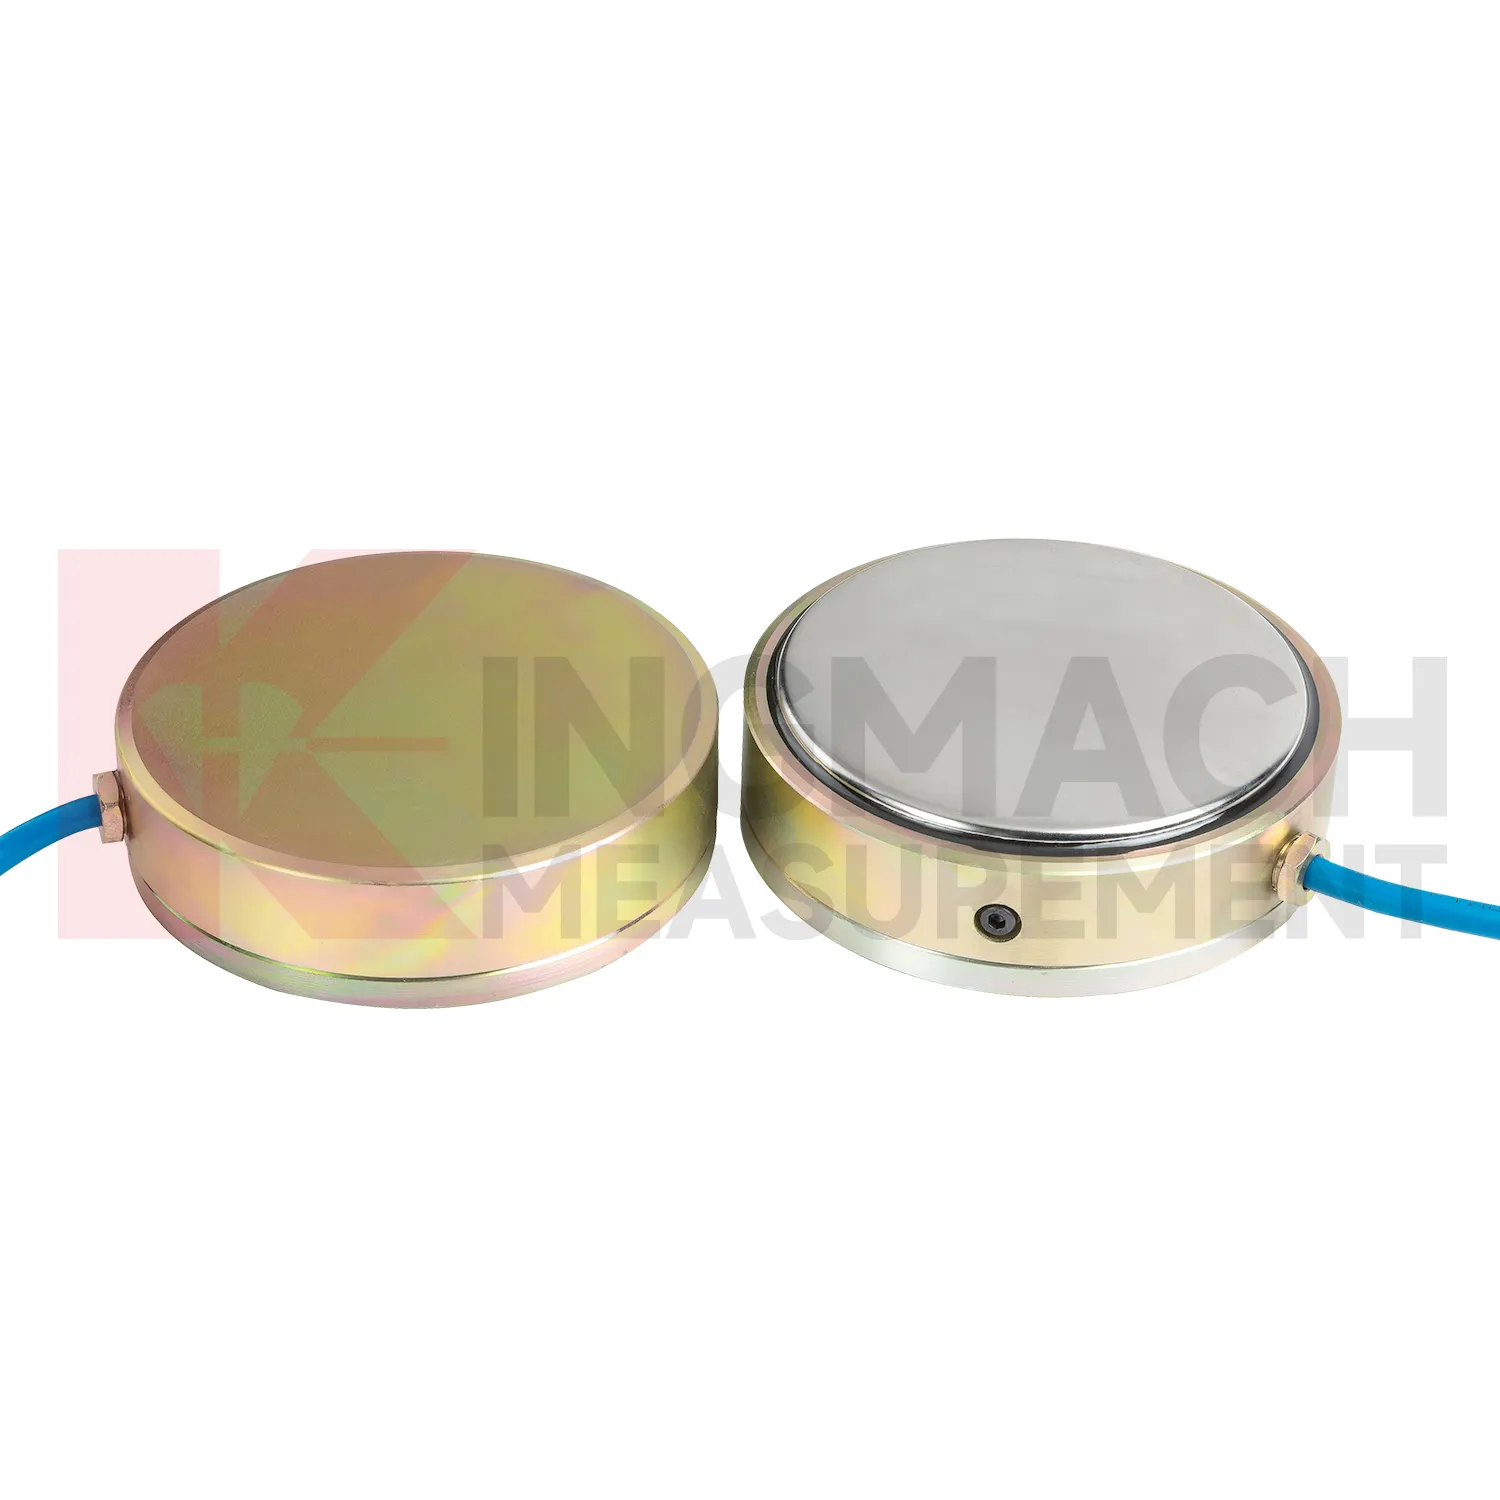
In bridge monitoring, load cell wiring diagram can be used at cable anchor heads, stay cable force points, pier supports, bearing test positions, and pile load test setups. The pain point is simple: a bridge can redistribute force before visible cracks or displacement appear. Hollow load cells such as the JMZX-3XXXHAT cover 500 kN to 8000 kN and are built around an annular multi-string structure with temperature correction and waterproof durability. Solid load cells reach 10000 kN with 0.5%FS precision, which suits high capacity compression points and bearing capacity checks. During construction, readings can confirm prestressing, lock-off behavior, and support load transfer. During operation, the same point can be reviewed after heavy traffic, temperature swings, maintenance work, or extreme weather. Force data becomes more meaningful when compared with displacement transducers, settlement points, tiltmeters, and visual inspection results. For long span bridges, a load trend that drifts slowly can be more important than a single high reading, because it may reveal relaxation, seating loss, or uneven force sharing. Cable exit direction, waterproof joint location, inspection access, and whether the point will be buried or exposed should be decided before installation. Those details are easy to ignore in drawings, but they often decide whether a field crew can verify the reading later without disturbing the structure.
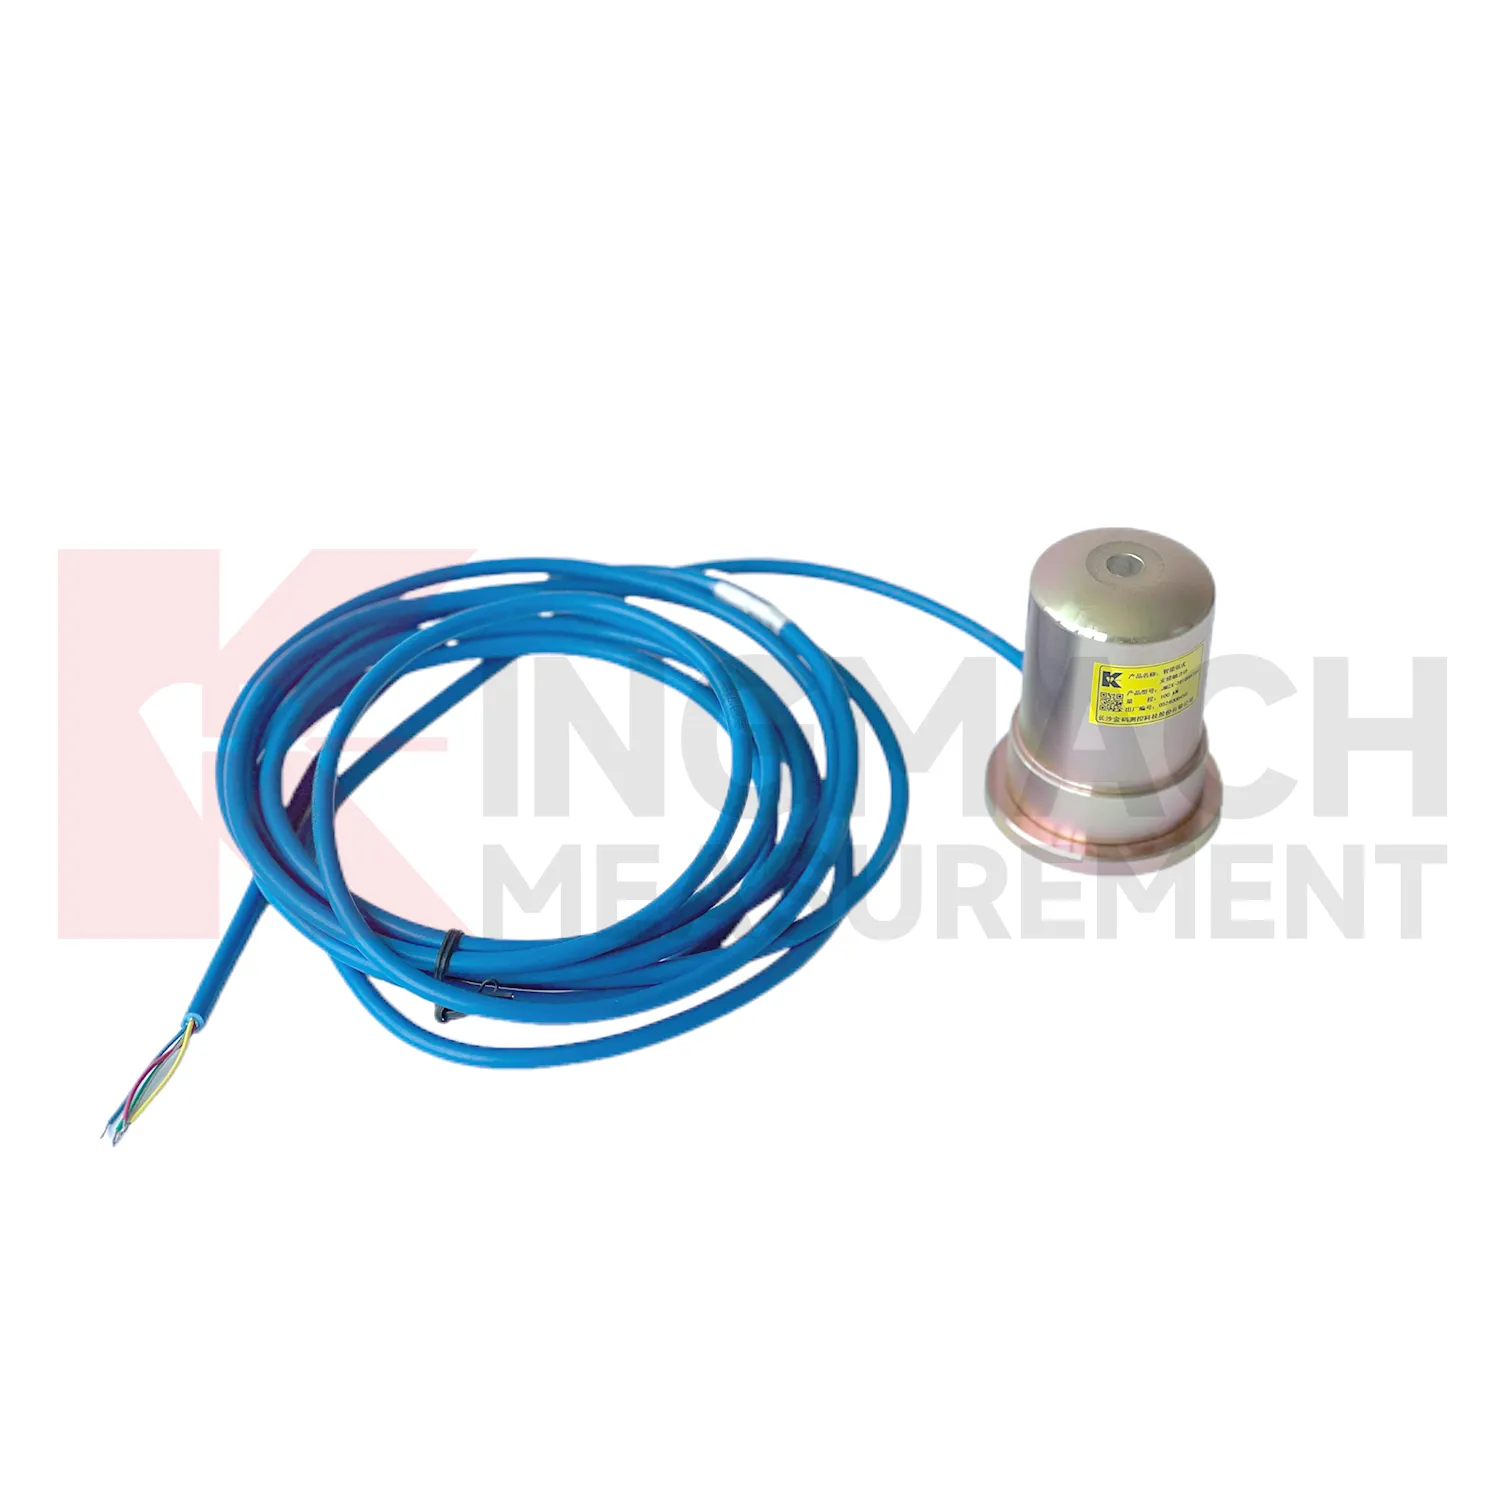
The future of load cell wiring diagram
The next stage for load cell wiring diagram in infrastructure monitoring is tighter integration with site data systems. Smart sensors already store model data, calibration coefficients, zero values, temperature readings, and measurement records on selected Kingmach products. The practical path is to connect that identity data with 4G, LoRa, wired acquisition, or 5G gateways, then place the force trend beside displacement, settlement, pore pressure, and rainfall in the same review screen. This matters because future warnings will be less about one limit value and more about patterns: force rising after excavation, anchor load falling after heavy rain, or bridge cable force drifting during seasonal temperature cycles. Digital twin models can use those readings when the sensor location, range, and calibration background are reliable. Standards and owner specifications for structural health monitoring are also becoming more data traceability focused, which favors instruments that can carry their own calibration identity and remain readable through long service periods.
Care & Maintenance of load cell wiring diagram
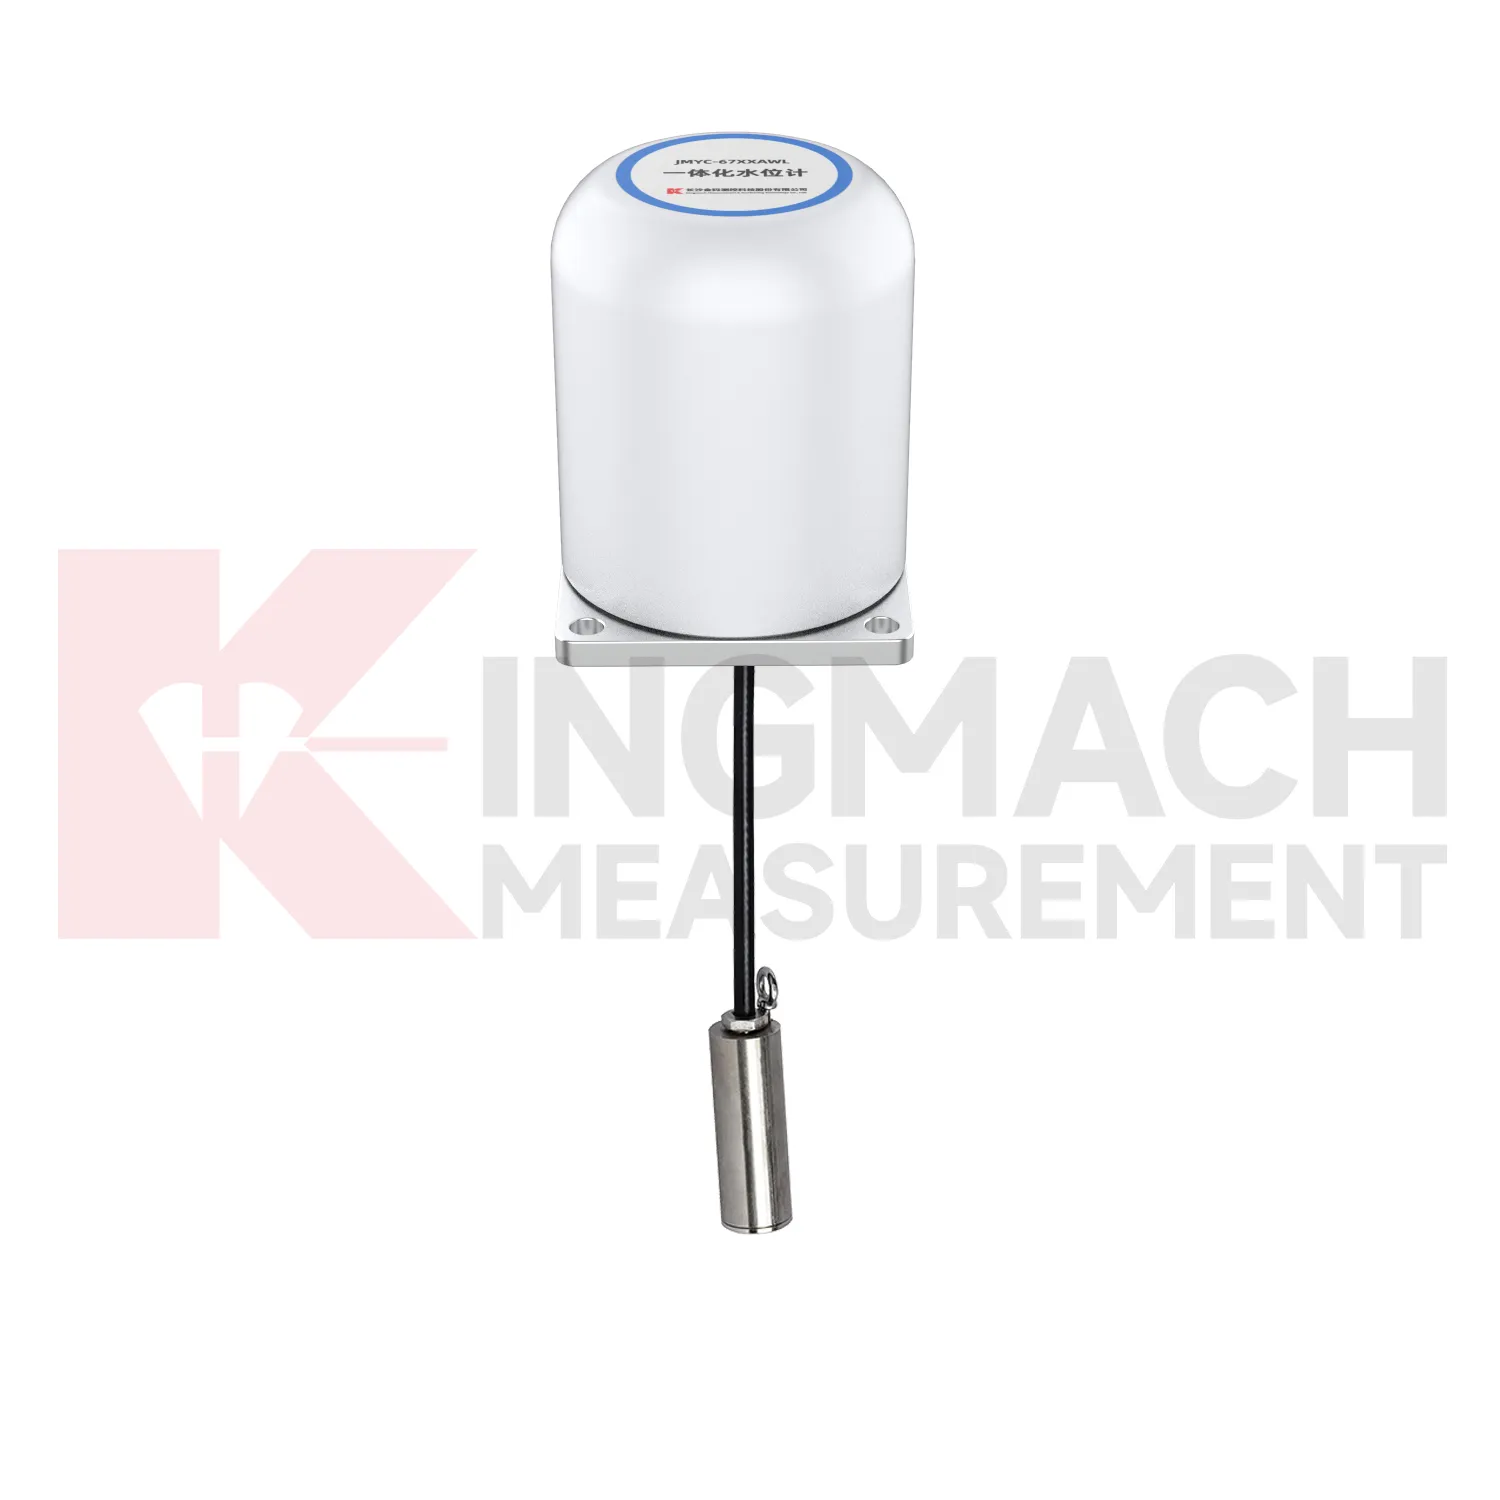
For load cell wiring diagram in dam, slope, and embankment monitoring, long term maintenance should emphasize water resistance and traceable records. Some Kingmach load and pressure products list a 50 year design life, but cables, connectors, junction boxes, and exposed labels may age faster than the sensing element. During installation, keep the sensing face clean, avoid impact, secure the cable route, and document depth, location, orientation, and initial reading. Earth pressure cells with 0.3 MPa to 8 MPa ranges and 0.5%FS pressure accuracy should be checked against design pressure and burial condition. During operation, inspect after heavy rain, reservoir level change, freezing weather, nearby excavation, or maintenance work. Look for water entry, cable abrasion, rodent damage, connector corrosion, and channel mix-ups. Readings should be compared with water level, seepage, settlement, and slope movement. A slow drift may be real ground behavior, but only if the field hardware remains in good condition.
Kingmach load cell wiring diagram
load cell wiring diagram is useful where the risk is not dramatic movement but slow, uneven load transfer. A bridge cable may relax in small steps, a support jack may settle after locking, a foundation pit strut may gain force overnight, and a dam anchor may respond to water level changes. Kingmach force monitoring products are designed for these long observation periods, with smart chips, temperature correction, waterproof structures, and compatible readouts or acquisition units across several models. The working value comes from repeatable measurement under real site conditions. That includes dust, water, vibration, long cable runs, tight installation space, and crews working around the instrument. A good record helps teams separate normal load fluctuation from a developing problem. It also reduces arguments during handover, because the reading is tied to a named point, a calibrated model, a timestamp, and the same measurement method used throughout the project. The result is a record that can survive handover between contractors and owners.
FAQ
Q: How can load cell wiring diagram be connected to a monitoring platform? A: Use compatible readouts, acquisition modules, data loggers, DTUs, and software platforms according to site access, cable distance, power, and reporting requirements. Q: What makes smart models useful in large networks? A: Stored model data, calibration coefficients, zero values, temperature data, and measurement records reduce confusion across many channels. Q: Should manual readings still be kept? A: Yes, manual checks are useful after installation, maintenance, abnormal alarms, or logger changes. Q: How should alarm limits be set? A: Base them on design stage, sensor range, expected load change, temperature behavior, and nearby monitoring points. Q: What data should be reviewed together with force? A: Settlement, displacement, tilt, water level, pore pressure, rainfall, temperature, construction events, and inspection notes.
Reviews
Michael Anderson
The strain gauges and load cells are extremely accurate and stable. They performed very well in our bridge monitoring project. Highly recommended!
Matthew Garcia
Instrumentation cables are durable and perform well even in harsh environments. Will definitely order again.
Latest Inquiries
To protect the privacy of our buyers, only public service email domains like Gmail, Yahoo, and MSN will be displayed. Additionally, only a limited portion of the inquiry content will be shown.
Harper***@gmail.comIndia
Dear Sir, we are planning to procure a complete monitoring system including strain gauges, tiltmeter...
Sophia***@gmail.comUnited Kingdom
Good day, we need environmental monitoring sensors including temperature, humidity, and wind sensors...